
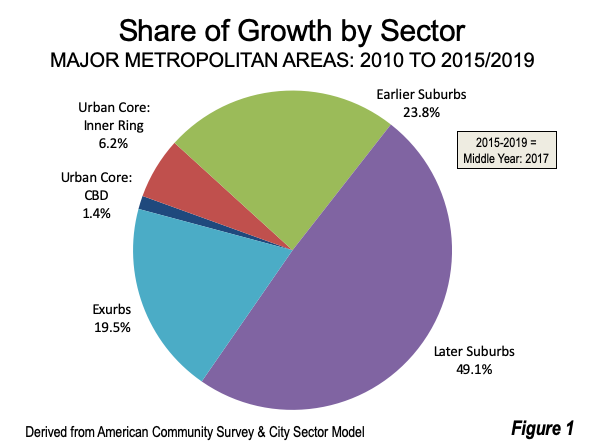
The latest complete American Community Survey (ACS) data, analyzed by the Demographia City Sector Model, indicates that population growth in the nation’s 53 major metropolitan areas (over 1,000,000 residents) continues to be, even before the pandemic, overwhelmingly suburban and exurban. Between 2010 and the average analysis year of 2017 (ACS data for 2015 to 2019), the suburbs and exurbs captured 92.4% of the population growth, with the balance of 7.6% in the urban cores (Figure 1). This growth rate is little more than one-half the share of residents who lived in the urban core in 2010.
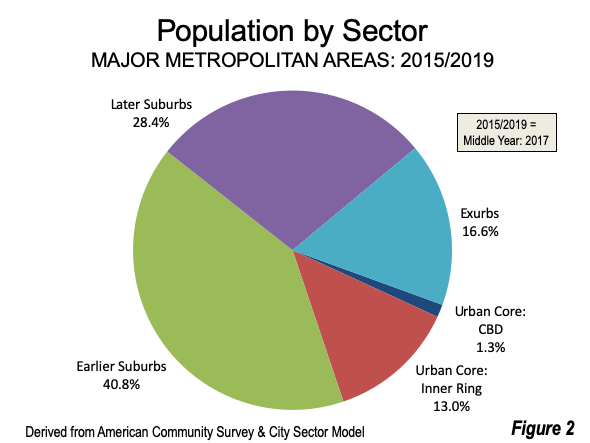
As a result of these trends, the latest Demographia City Sector Model analysis estimates that 85.7% of the major metropolitan area residents live in the suburbs and exurbs, leaving only 14.3% in the urban cores (Figure 2).
The Demographia City Sector Model
Demographia City Sector Model analysis is now in the seventh year of publication. Improved data from the American Community Survey made it possible to separate demographic data based on life styles and functions within metropolitan areas. Before that, nearly all urban, suburban and exurban analysis within metropolitan areas was based on municipal or county jurisdictions. The problem was, however, that nearly all new development since World War II had been lower density, principally single-family houses, while the automobile quickly replaced much of the commuting that had been previously been on transit or on foot.
The Demographia City Sector Model classifies zip code residents based upon their population density and extent of automobile commuting into four functional classifications, which are indicated in Figure 3. The intent is to separate the pre-World War II city from the very different city that has developed in the intervening three-quarters of a century.
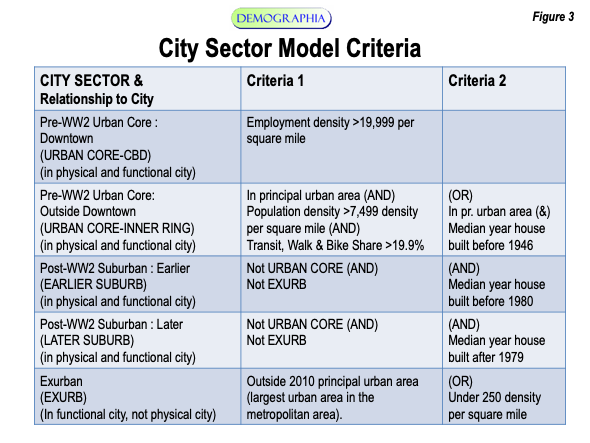
The formerly monocentric city (metropolitan area), with a large share of workers commuting to downtown, many by transit, has been replaced by a more polycentric, but principally dispersed employment distribution that can only be served by car within the 30 minute commute time most people choose. The pandemic seems likely to have accelerated this trend, and likely will continue to impact commuting patterns even after things return to “normal”.
Trend Since 2010
The trend toward suburbia (suburbs and exurbs) is not what it was in the early part of the new century, much less than in the 1950s to 1990s, when many core municipalities were losing population. Yet since 2010 the shift to suburbs and exurbs has again accelerated. In the last year, the share of residents added to the urban cores was 2.5% of major metropolitan growth, one-third of the rate over the decade.
Finally, this is before the pandemic. There are considerable indications that the preference for lower density, auto-oriented and teleworking life revealed during the pandemic could presage an even lower density future.
Trends in the Sectors
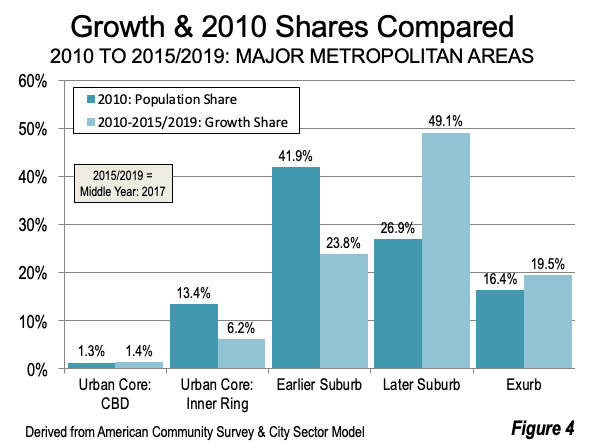
Three of the City Sectors have grown at a rate since the beginning of the decade greater than their 2010 share of the population (Figure 4). The later suburbs share grew at a rate thre-quarters more than 2010 population share, while the exurbs grew 19% more. The Urban Core-CBD grew 4% more than their 2010 share, though have only a small part of the population (1.4%). The much larger Urban Core-Inner Ring grew at a rate less than one-half of its 2010 population share, as the overall Urban Core share dropped three percent.
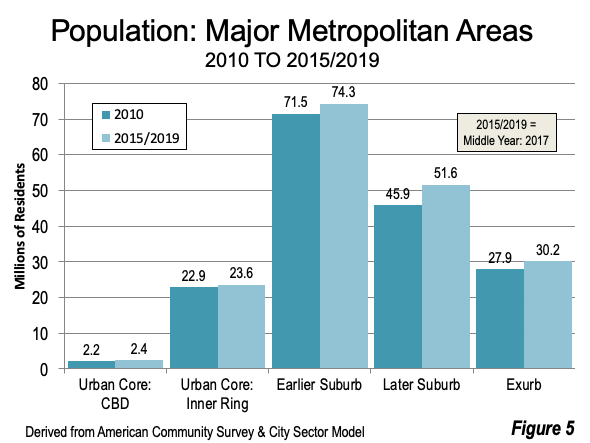
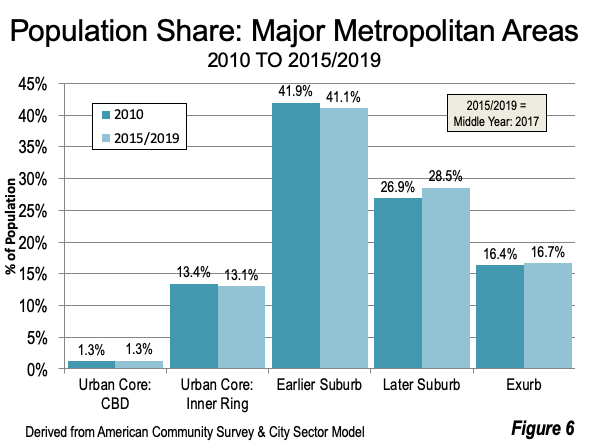
Since 2010, the largest growth has been in the Later Suburbs (median house built 1980 or later), at 5.7 million, while the Exurbs gained 2.3 million. The Exurbs gained more than twice the population gain of the two Urban Core sectors (Figure 5). The corresponding changes in the share of population by sector are shown in Figure 6.
Separating the Untypical from the Typical: Legacy City Metropolitan Areas v. the Rest
The trends indicated above are often missed by the national media, headquartered as it is in metropolitan areas with the most vibrant pre-pandemic urban cores. For example, an analysis based solely on trends in New York metropolitan areaswould yield a much different conclusion.
While only 7.6% of growth in the 53 major metropolitan areas was in the urban cores from 2010 to 2015-2019, 76% of the metropolitan area growth in New York was in the urban core (Figure 7). New York is the ultimate “legacy city” in the United States, so designated because of its huge central business district (Manhattan) and its large huge pool of mass transit commuters. In 2019, 36% of the nation’s transit commuters worked in the city of New York, which despite its concentrated employment, is home to only three percent of the nation’s jobs (1/12th of its transit destination share) according to American Community Survey data.
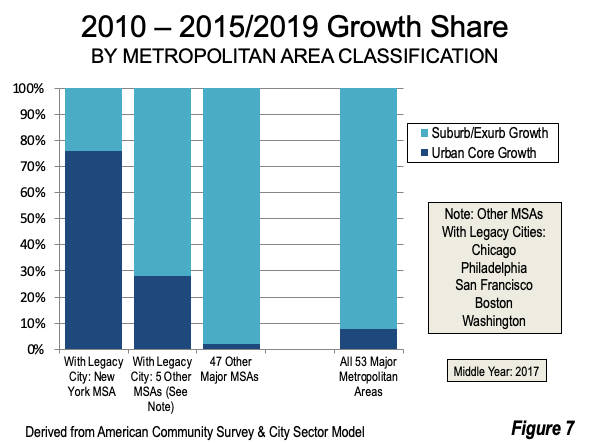
The other legacy cities have far lower urban core growth shares, but far greater shares than the other major metropolitan areas. Between 2010 and 2015-9, Boston’s urban core accounted for 43% of the metropolitan area’s growth, Philadelphia’s urban core captured 35%, San Francisco 24%, Washington 22% and Chicago 21%. None of the other 47 major metropolitan areas had a greater share of its growth in the urban core.
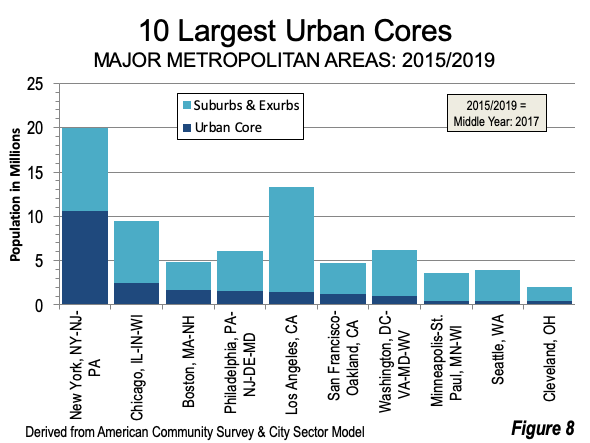
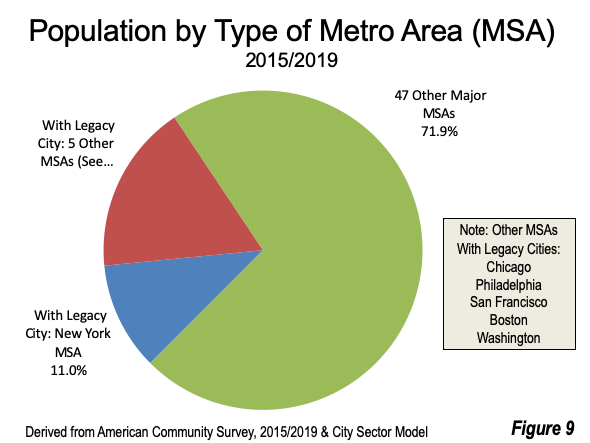
These six legacy city metropolitan areas have the six of the seven largest urban cores (Figure 8) and the six central business districts, and their central municipalities alone have 58% of the nation’s transit commuting destinations. The legacy city metros also account for more than a quarter of the nation’s major metropolitan population (Figure 9).
Typical Metropolitan America
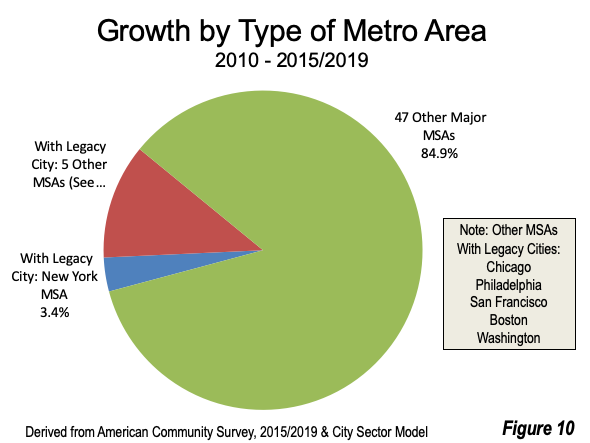
However, the other 47 other major metropolitan areas have nearly three-quarters of the nation’s major metropolitan area population. Since 2010, they have accounted for 85% of the major metropolitan growth (Figure 10). This growth is nearly all in the suburbs and exurbs (98%), as Figure 7, above indicates. These metros, which include most of the fastest growing areas, are more typical of America today, and seem to be poised to increase their share in the years ahead as people look for more affordable locales where there is less crowding and they feel safer.
Wendell Cox is principal of Demographia, an international public policy firm located in the St. Louis metropolitan area. He is a founding senior fellow at the Urban Reform Institute, Houston and a member of the Advisory Board of the Center for Demographics and Policy at Chapman University in Orange, California. He has served as a visiting professor at the Conservatoire National des Arts et Metiers in Paris. His principal interests are economics, poverty alleviation, demographics, urban policy and transport. He is co-author of the annual Demographia International Housing Affordability Survey and author of Demographia World Urban Areas.
Mayor Tom Bradley appointed him to three terms on the Los Angeles County Transportation Commission (1977-1985) and Speaker of the House Newt Gingrich appointed him to the Amtrak Reform Council, to complete the unexpired term of New Jersey Governor Christine Todd Whitman (1999-2002). He is author of War on the Dream: How Anti-Sprawl Policy Threatens the Quality of Life and Toward More Prosperous Cities: A Framing Essay on Urban Areas, Transport, Planning and the Dimensions of Sustainability.
Photograph: Columbus, Ohio (Lincoln-LeVeque Tower): One of the 47 more typical major metropolitan areas (by author).


