
Returning to Normalcy
The Bureau of the Census has just released metropolitan and county population estimates for 2008, with estimates of the components of population change, including domestic migration. Consistent with the “mantra” of a perceived return to cities from the suburbs, some analysts have virtually declared the new data as indicating the trend that has been forecast for more than one-half a century. In fact, the new population and domestic migration data merely indicates the end of a domestic migration bubble, coinciding with the end of the housing bubble.
Metropolitan Area Growth: As usual, the metropolitan areas with more than 1,000,000 population increased above the national rate of 7.8 percent, at 9.2 percent from 2000 to 2008. Smaller metropolitan areas (between 50,000 and 1,000,000 population) grew at the national rate of 7.8 percent. Also continuing a long-standing pattern, areas outside metropolitan areas (including rural areas) grew slower, at only 0.7 percent (Table 1).
The overall trends, however, mask significant variations. The nation’s two metropolitan areas with more than 10,000,000 population are experiencing growth rates less than one-half the national average. New York grew only 3.6 percent, while Los Angeles – which for decades experienced above average growth, could manage only one-half the national average rate, at 3.8 percent. Indeed, Chicago grew faster, at 5.0 percent. If 2000s growth rates were to continue to 2050, Dallas-Fort Worth, Atlanta and Phoenix would exceed Los Angeles in population, while Houston would pass Los Angeles shortly thereafter. This is not a prediction – population growth in these fast growing areas will likely slow as they get larger – but is merely offered to show how moribund the Los Angeles growth rate has become.
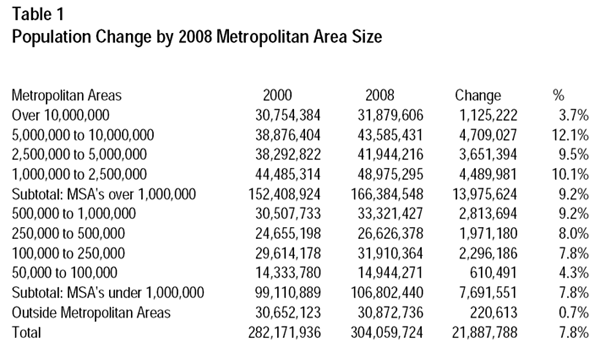
The strongest growth was among metropolitan areas with between 5,000,000 and 10,000,000 population, which added 12.1 percent to their populations. This was driven by gains of more than 1,000,000 in Dallas-Fort Worth and Atlanta, nearly 1,000,000 in Houston and over 500,000 in Washington (DC). Philadelphia’s growth rate, however, was even less than that of New York or Los Angeles, at 2.7 percent.
There was also strong growth (9.5%) among the metropolitan areas with between 2,500,000 and 5,000,000 population. This was driven by an increase of more than 1,000,000 in Phoenix and more than 800,000 in Riverside-San Bernardino. San Francisco (3.3 percent) and Boston (2.7 percent) grew at less than one-half the national rate, while Detroit lost population.
The metropolitan areas with between 1,000,000 and 2,500,000 population also grew more than the national average, at 10.5 percent. The strongest growth was in Las Vegas, which added nearly 475,000 residents. Charlotte, Sacramento and Austin also added more than 300,000. Providence, Milwaukee and Hartford all experienced growth at less than one-half the national rate; while Cleveland, Pittsburgh, Buffalo and Katrina ravaged New Orleans all lost population. Tucson became the nation’s 52nd metropolitan area with more than 1,000,000 population in 2008, having added nearly 20 percent to its population since 2000.
The largest percentage growth (35.4%) among metropolitan areas over 1,000,000 population was in Raleigh, which added 284,000 new residents (This is not Raleigh-Durham, which the Bureau of the Census calls a combined statistical area, consisting of the Raleigh metropolitan area and the Durham metropolitan area). Raleigh displaced recent perennial growth leader Las Vegas, which experienced slower growth due to the collapse of the housing bubble.
Domestic Migration
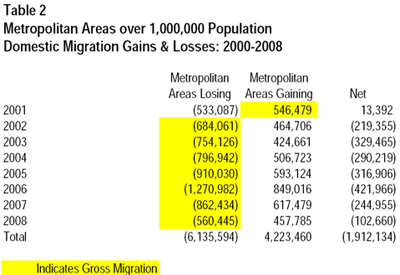
Much has been made of the apparent recent slow-down in domestic migration (residents moving from one county to another) as indicated in the new data. In fact, however, domestic migration was greater in 2008 than it was in 2001. The slow-down should be more appropriately viewed as a return to more normal conditions.
This can be illustrated by examining the gross domestic migration between metropolitan areas over 1,000,000 population. In 2008, gross migration in the metropolitan areas of more than 1,000,000 was 560,000. This is slightly more than the 546,000 in 2001. Gross migration increased after 2001, peaking at 1,270,000 in 2006. This fell to 862,000 in 2007 and then to 560,000 in 2008 (Table 2).
The Domestic Migration Bubble
The domestic migration bubble that developed from 2000 through 2007 coincided with the domestic housing bubble. This is not surprising, because housing consumes a major part of household expenditures. The differences in housing costs are much greater between metropolitan areas than any other major category of personal expenditure. For example, transportation, clothing and food have similar costs among the nation’s metropolitan areas. During the bubble, however house prices doubled and tripled in some metropolitan areas relative to incomes. The housing bubble appears to have sparked its own domestic migration bubble, as people moved from less affordable areas to more affordable areas.
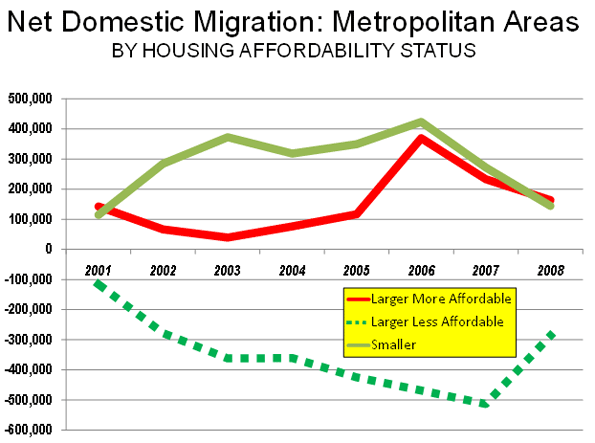
This is illustrated by examining domestic migration trends by housing affordability. The more affordable metropolitan areas had Median Multiples at the peak of the housing bubble of 4.0 or less (The “affordable” and “moderately unaffordable” categories from the Demographia International Housing Affordability Survey) and the less affordable metropolitan areas had Median Multiples of 4.1 or above (the “seriously unaffordable” and “severely unaffordable” categories from the Demographia International Housing Affordability Survey).
The less affordable (higher cost) metropolitan areas experienced both the largest house price increases and a spike in net domestic migration losses. Overall, the less affordable metropolitan areas lost 2.8 million domestic migrants from 2000 to 2008 (Table 3 and Figure). This started in 2001 with a modest loss of 116,000, which ballooned to 514,000 by 2007. The loss dropped to 287,000 in 2008, a figure more than 2.5 times the 2001 net domestic migration loss.
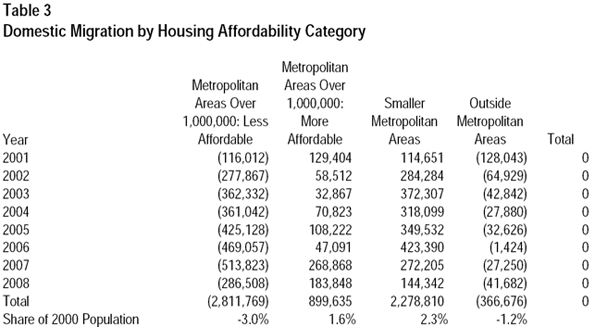
At the same time, the affordable metropolitan areas experienced substantially lower house price escalation, while gaining nearly 900,000 domestic migrants from 2000 to 2008. In 2001, the more affordable metropolitan areas experienced a net domestic migration gain of nearly 129,000. Domestic migration gains peaked in 2007, at 269,000. Domestic migration gains fell to 184,000 in 2008 in the more affordable metropolitan areas. However, this figure was still far higher than the numbers at the beginning of the decade.
Suburbs Continue to Gain
The data also shows that people continue to move to the suburbs and move away from core areas. This can be shown from the county data, which is generally the smallest geographic area for which migration data is produced. One caveat: because many core counties contain suburban areas as well as the historic core cities, a county based migration analysis usually understates the extent of both core losses and suburban gains.
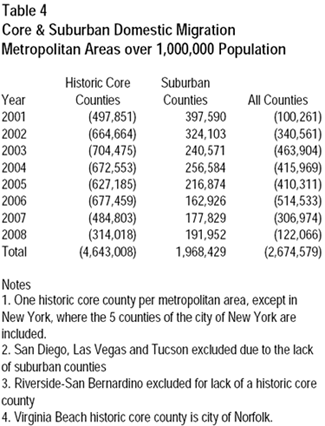
The core counties improved their domestic migration performance in 2008, but continue to suffer losses. In 2008, the net domestic migration loss in core counties was 314,000, which compares to the 498,000 loss in 2001 and an annual average loss of 580,000 over the decade. Losses of this magnitude can hardly be characterized as a “turnaround.”
Net domestic migration gains were down to 192,000 in the suburban counties from a 398,000 gain in 2001 and an average gain of 246,000 over the period. However, net suburban migration gains were up in 2008 from 2007 and 2006 (Table 4). Out of the 48 metropolitan areas, suburban counties performed better than core counties in net domestic migration in 42 cases, matching the figure for 2000-2008, the same as in 2007 and up from 38 in 2006. Among the six metropolitan areas where core net migration was greater than in the suburbs, core counties lost fewer domestic migrants than the suburbs (Washington and Virginia Beach), three were areas where the core county typically experiences higher net migration because of its population dominance (Phoenix, Raleigh and San Antonio) and the last was New Orleans, where the core county was much harder hit than the suburban counties by Hurricane Katrina related losses leading to greater gains in domestic migrants as it recovers (Orleans Parish, which is also the city of New Orleans). It is more than “a stretch” to interpret the new data to suggest any move to core areas from suburban areas.
The 2008 domestic migration data does indicate a slow down or even a reversal in some more distant suburban and exurban areas. This was also to be expected because these areas had experienced a large increase in home ownership and a high volume of high risk sub-prime lending.
As a result, exurban metropolitan areas like Riverside-San Bernardino, Stockton, Modesto and Merced experienced domestic migration reversals, while distant counties within metropolitan areas (such as Stafford County, Virginia in the Washington area and Pike County, Pennsylvania in the New York area) saw declines in their domestic migration. Much of the growth in such more distant areas occurred because of planning regulations in closer in areas made new development impossible or impossibly expensive. Thus, new housing construction was forced to “leap frog” over developable land, which also imposed higher transportation costs and longer commuting distances on the new home owners.
At the same time, the better domestic migration performance in some core counties and “closer-in” counties occurred in large part because households no longer had a financial incentive to “cash-out” and move to lower cost areas, since they were often facing negative equity. This removed much of the incentive to move from San Francisco or Los Angeles to Las Vegas, Reno, Phoenix, Tucson or Portland, where prices were considerably lower (though still much higher than before).
The Real Story: Widening Dispersion
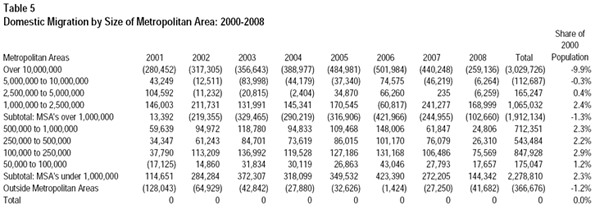
Not only are people continuing to move from core areas to more suburban areas, but they are also moving from larger metropolitan areas to smaller metropolitan areas (Table 5). Since 2000, approximately 2,275,000 people have moved from large metropolitan areas and non-metropolitan areas to smaller metropolitan areas – those with populations of between 50,000 and 1,000,000. In 2001, the smaller metropolitan areas gained 115,000 domestic migrants. These net migration gains peaked in 2006, at 423,000. Following the national trend, net domestic migration to smaller metropolitan areas fell to 144,000 in 2008, still in excess of the 2001 number. Net domestic migration in the smaller metropolitan areas exceeded that of the larger less affordable metropolitan areas by 5.1 million over the period and exceeded that of the larger more affordable metropolitan areas by 1.4 million.
Despite these trends, most metropolitan areas continue to add population. The domestic migration losses are more often than not made up by the natural increase in population (births minus deaths) and net international migration gains.
However, households who already live here continue to exhibit a pattern of dispersion. Both within the same metropolitan area and between metropolitan areas, the latest Bureau of the Census data continues to show a clear trend of wider dispersal – from core counties to suburban counties and from larger metropolitan areas to smaller.
References:Major Metropolitan Area Population & Domestic Migration 2000-2008: http://www.demographia.com/db-2008met.pdf
Wendell Cox is a Visiting Professor, Conservatoire National des Arts et Metiers, Paris. He was born in Los Angeles and was appointed to three terms on the Los Angeles County Transportation Commission by Mayor Tom Bradley. He is the author of “War on the Dream: How Anti-Sprawl Policy Threatens the Quality of Life.”


diseño web valencia
Surveying and mapping technicians – Perform surveying and mapping duties, usually under the direction of an engineer, surveyor, cartographer, or photogrammetrist to obtain data used for construction, mapmaking, boundary location, mining, or other purposes. diseño web valencia