
Concern about overcrowded housing has been heightened by its association with greater COVID-19 infection risk. As a disease transmitted by human proximity, exposure is increased by being in overcrowded and insufficiently ventilated spaces where sufficient social distancing is not possible. Exposure density for a person is intensified by the amount of time spent in such circumstances. In this case, overcrowded housing is a particular worry.
Overcrowded housing is largely an issue of insufficient income. People tend to live in overcrowded housing only when they cannot afford more spacious accommodations.
This article reviews the latest data on housing overcrowding for the 53 major metropolitan areas (over 1,000,000 population) in the United States, with data provided for all households, homeowners, and renters. Data is also provided for urban cores, suburbs, and exurbs, using the City Sector Model.
Overcrowding: All Occupied Housing
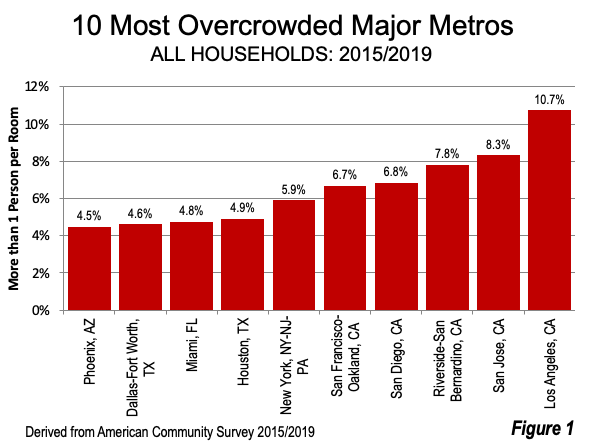
Out of the 53 major metropolitan areas, the five with the largest share of overcrowded housing are all in California (Figure 1). Los Angeles has by far the worst overcrowding, at 10.7% of households. This is more than 2.5 times the national rate of 3.9% and 30% more severe than San Jose, which has the second most severe overcrowding rate. San Jose, which is the most affluent (median household income) among the 53 metropolitan areas, and an overcrowding rate of 8.3%. San Jose is the core of the world’s leading technology hub, Silicon Valley. The third worst overcrowding is in Riverside-San Bernardino, at 7.8%. San Diego is fourth worst, at 6.8%. San Francisco, which includes the balance of Silicon Valley not in San Jose, has the fifth worst overcrowding, at 6.7%. New York, the sixth worst, is the only other major metropolitan area with a greater than 5% overcrowding rate.
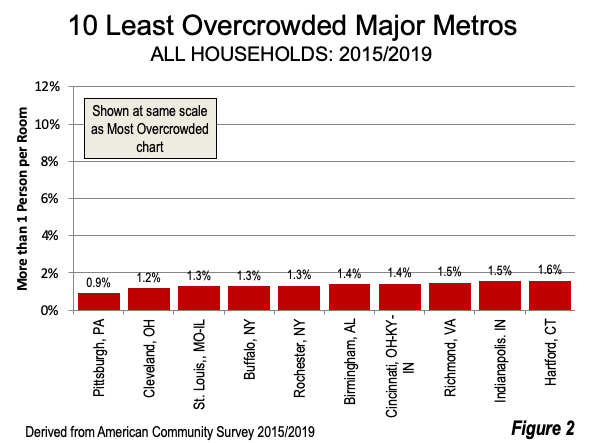
The least overcrowded metropolitan areas were Pittsburgh, Cleveland, and St. Louis, with the top ten ranging from 0.9% to 1.6% (Figure 2). On average, the ten metropolitan areas with the highest overcrowding rates have about five times the rate endured in the lowest 10 metropolitan areas among all households.
Overcrowding: Home Owners
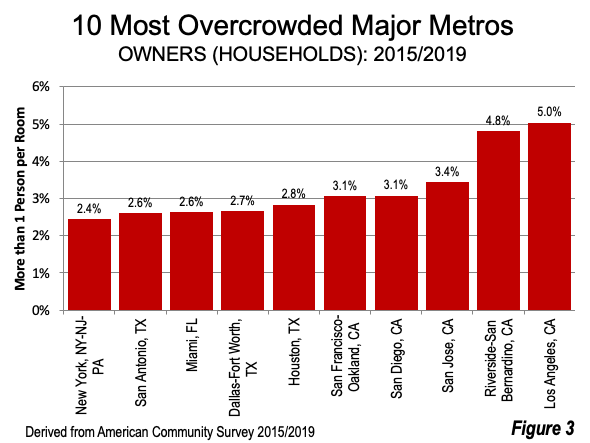
The same five California metropolitan areas have the worst housing overcrowding among homeowners (Figure 3). Los Angeles, again, is the worst, at 5.0% and is followed by adjacent Riverside-San Bernardino at 4.8%. San Jose has considerably less overcrowding among homeowners, at 3.4%, but still ranks third worst. San Diego and San Francisco have overcrowding rates of 3.1% among homeowners.
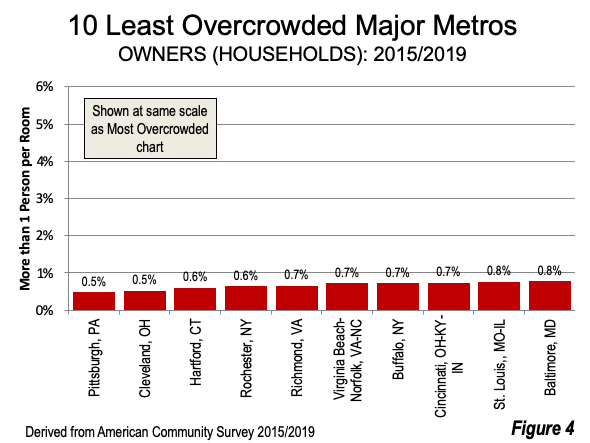
Pittsburgh, Cleveland, and Buffalo had the lowest homeowner overcrowding rates, with the top ten ranging from 0.5% to 0.8% (Figure 4). On average, the ten metropolitan areas with the highest overcrowding rates have about five times the rate of the lowest 10 metropolitan areas among owner households.
Overcrowding: Renters
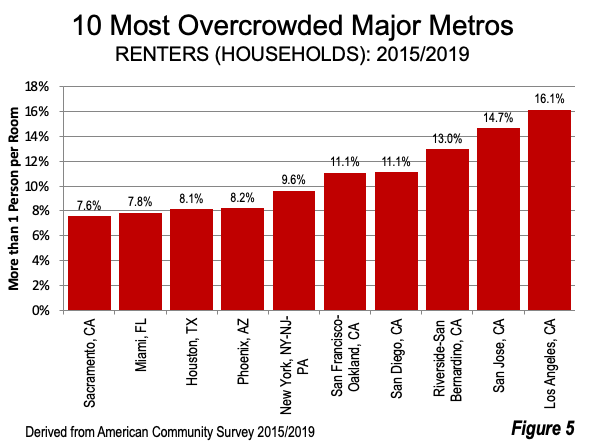
Among renters, the same five California metropolitan areas have the worst overcrowding rates among the major metropolitan areas (Figure 5). Again, Los Angeles has the worst rate, at 16.1%. San Jose is second worst, at 14.7%, followed by Riverside-San Bernardino, at 13.0. San Diego and San Francisco (both at 11.1%) are the only other major metropolitan areas with an overcrowding rate among renters of 10% or more.
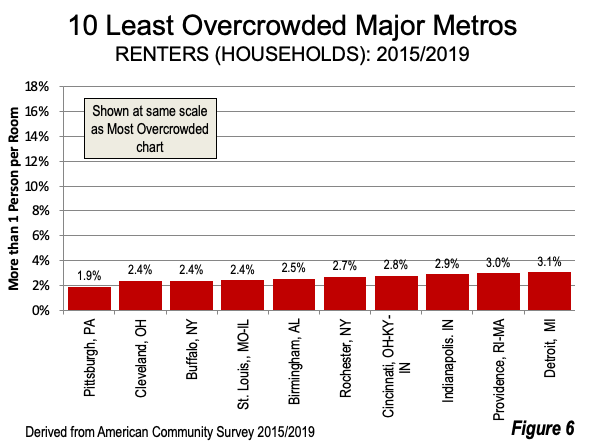
The ten lowest renter overcrowding rates range from 1.9% to 3.1%. The lowest overcrowding rates are in Pittsburgh, Cleveland, and Buffalo (Figure 6), On average, the ten metropolitan areas with the highest overcrowding rates have about four times the rate of the lowest 10 metropolitan areas among renter households.
The Demographia City Sector Model
Demographia City Sector Model analysis is now in the seventh year of publication. Improved data from the American Community Survey made it possible to separate demographic data based on lifestyles and functions within metropolitan areas. Before that, nearly all urban, suburban, and exurban analysis within metropolitan areas was based on municipal or county jurisdictions. The problem was, however, that nearly all new development since World War II had been lower density, principally single-family houses, while the automobile quickly replaced much of the commuting that had been previously been on transit or on foot.
The Demographia City Sector Model classifies zip code residents based upon their population density and extent of automobile commuting into four functional classifications, which are indicated in Figure 7. The intent is to separate the pre-World War II city from the very different city that has developed in the intervening three-quarters of a century.

Overcrowding by Metropolitan Sector: All Households
Among the metropolitan area sectors, the highest overall housing overcrowding rate (owners and renters) is in the Urban Core: Inner Ring, that includes the higher density residential areas directly adjacent to the downtowns, at 6.4%. This is nearly two-thirds higher than the overall rate of 3.9%. Overcrowding in the Urban Core: Central Business District (downtown) is a 5.2%, one third above the overall rate. The Earlier Suburbs have an overcrowding rate of 4.6 %, while the Later Suburbs and Exurbs share a 2.6% rate, one third below the overall average (Figure 8).

Overcrowding by Metropolitan Sector: Owners and Renters
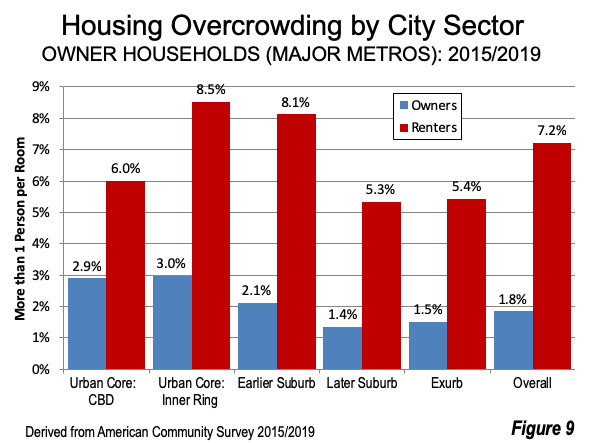
Again, the Urban Core: Inner ring has the highest overcrowding among owning households, at 3.2%, two-thirds above the overall rate of 1.8%. The Urban Core: Central Business District overcrowding rate for owners is nearly as high, at 2.9%. The Earlier Suburbs have a rate of 2.1%, approximately 15% higher than the overall rate. The Later Suburbs (1.4%) and the Exurbs (1.5%) have lower owner overcrowding rates than the average (Figure 9).
Among renters, the Urban Core: Inner Ring has the highest overcrowding rate, at 8.5%, nearly 20% above the overall renter rate of 7.2%. The Earlier Suburbs have the second highest overcrowding rate among renters, at 8.1%. The Urban Core: Central Business District has an overcrowding rate of 6.0% among renters, which is well below the overall rate of 7.2%. The Later Suburbs (5.3%) and Exurbs (5.4%) have renter overcrowding rates a quarter below the overall average (Figure 9).
Owning, Renting and Overcrowding
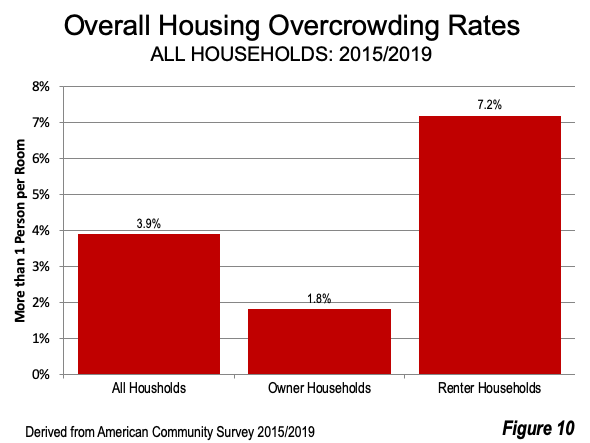
There is a strong relationship between rental housing and higher overcrowding rates. The renter overcrowding rate among the major metropolitan areas is 7.2%, 55% higher than the overall household rate. Among homeowners the overcrowding rate is 1.8%, 55% below the overall household average (Figure 10).
Where Housing Overcrowding is the Greatest
In each of the categories of all occupied housing, owned housing, and rental housing, the five major metropolitan areas with the highest overcrowding rates are in California. This includes the four large coastal metropolitan areas, Los Angeles, San Francisco, San Jose, and San Diego, as well as inland Riverside-San Bernardino. Moreover, greater overcrowding is associated with higher population densities, which occur in the Urban Cores.
Overcrowded housing has long been a problem, especially for low-income households. The nation’s “affordable housing” programs established to aid household unable to afford market rate housing costs have routinely fallen far short of political promises. It is a problem that needs to be effectively addressed.
Wendell Cox is principal of Demographia, an international public policy firm located in the St. Louis metropolitan area. He is a founding senior fellow at the Urban Reform Institute, Houston and a member of the Advisory Board of the Center for Demographics and Policy at Chapman University in Orange, California. He has served as a visiting professor at the Conservatoire National des Arts et Metiers in Paris. His principal interests are economics, poverty alleviation, demographics, urban policy and transport. He is co-author of the annual Demographia International Housing Affordability Survey and author of Demographia World Urban Areas.
Mayor Tom Bradley appointed him to three terms on the Los Angeles County Transportation Commission (1977-1985) and Speaker of the House Newt Gingrich appointed him to the Amtrak Reform Council, to complete the unexpired term of New Jersey Governor Christine Todd Whitman (1999-2002). He is author of War on the Dream: How Anti-Sprawl Policy Threatens the Quality of Life and Toward More Prosperous Cities: A Framing Essay on Urban Areas, Transport, Planning and the Dimensions of Sustainability.
Photograph: aerial view of the urban density of Los Angeles (by author).


