
A commenter asked about population trends in combined statistical areas (CSA) in response to my article “Demographic Implosion in the San Francisco Bay Area?, posted on May 18. This article deals with CSA population trends in the 88 CSAs with more than 500,000 population.
More Evidence of the Dispersion
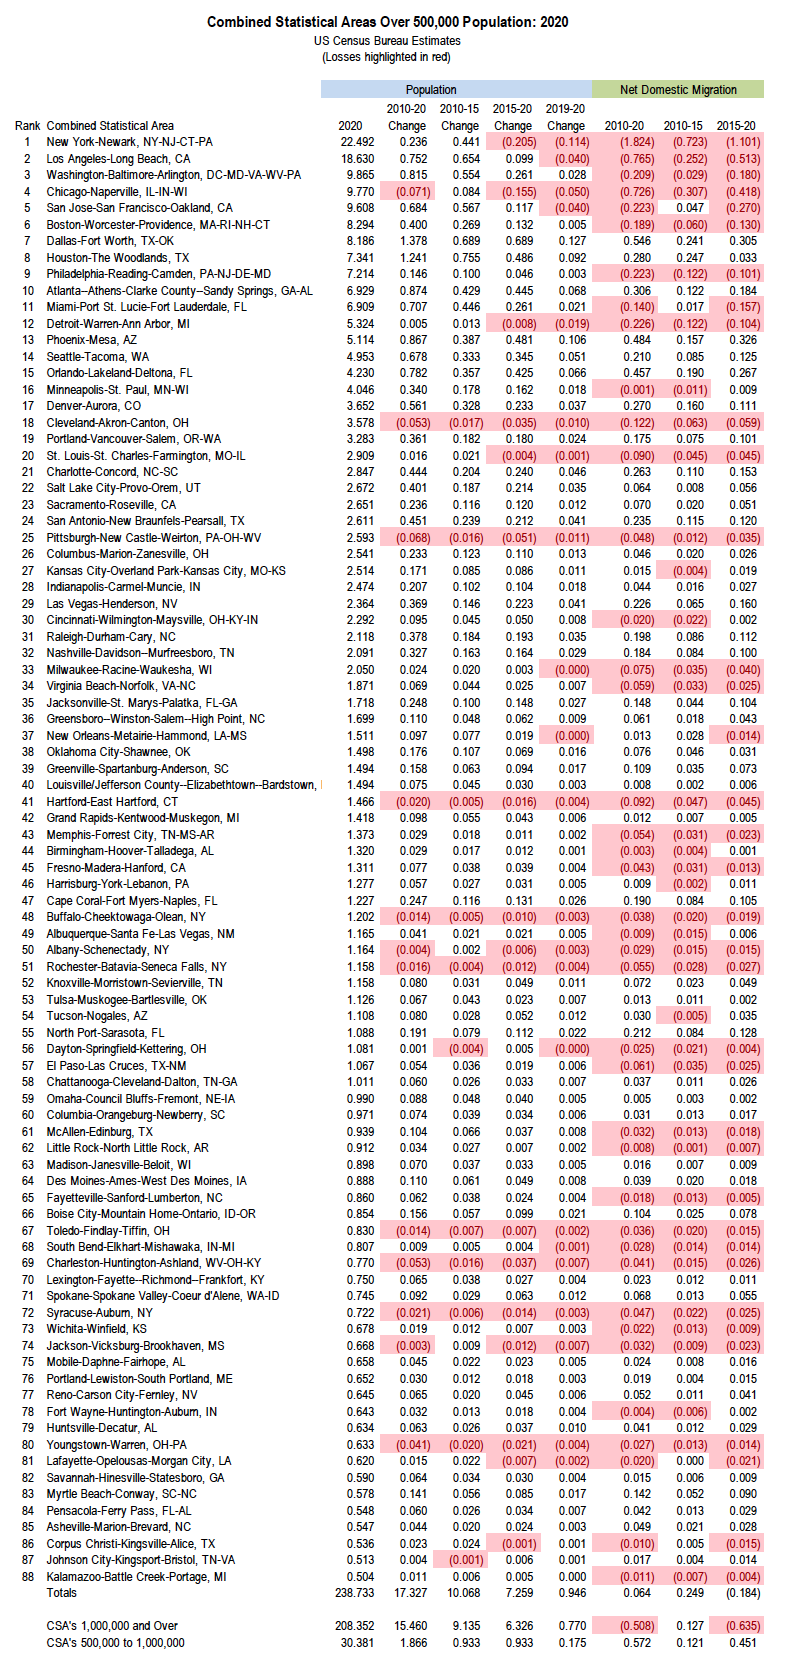
The nation’s largest combined statistical areas (over 1,000,000 residents) are showing a substantial decline in population growth and net domestic migration, while middle-sized CSA’s (500,000 to 1,000,000) are showing gains.
From 2010 to 2020, Census Bureau estimates indicate that the 58 CSAs with more than 1,000,000 population gained 9.1 million residents between 2010 and 2015, before dropping more than 30% from 2015 to 2020 to 6.3 million. By comparison, the 30 CSAs with from 500,000 to 1,000,000 population gained 933,000 residents both in the first and second half of the decade. Over the decade, the gross population increase rate was 8.0%, relative to the 2010 population.
Overall, the larger CSAs gained 127,000 net domestic migrants (people moving from into a CSA from another part of the nation) in the first half of the decade, then suffered a net loss of 635,000 in the second half. This represents a gross rate of minus 2.6% relative to the 2010 population. Among the middle-sized CSAs, net domestic migration increased from 121,000 in the first half of the decade to 451,000 in the second half. This calculates to a gross rate over the decade of 2.0% relative to the 2010 population.
This is more critical than simply a response to the pandemic. In reality these trends existed overwhelmingly pre-COVID — a single quarter out of 40 — during which multiple reports say has now increased more.
What is a CSA and How Does it Relate to Metropolitan Areas
A combined statistical area (CSA) is a set of overlapping labor markets (metropolitan and sometimes micropolitan areas) that have a significant interchange of workers (commuters) between homes and employment. There are 384 metropolitan areas in the nation and 543 micropolitan areas. The only difference between metropolitan and micropolitan areas is that metropolitan areas are based on urban areas of at least 50,000 residents, while micropolitan areas are based on urban areas of from 10,000 to 50,000. The 927 Metropolitan and micropolitan areas are collectively referred to as “core based statistical areas.”
There are also 175 CSA’s, made up of 551 complete metropolitan and micropolitan areas.
Observations on the Largest CSAs
Each of the six largest CSAs experienced much worse population growth trends in the second half of the decade (Table).
The 15 largest CSAs are summarized below: A number of metropolitan and micropolitan areas are not in CSAs and are not shown in the table. includes some of the largest metropolitan areas, such as San Diego, Austin, Las Vegas, and Rochester.
- New York gained 441,000 from 2010 to 2015, but lost 205,000 in 2015-2020. In the last year New York lost 114,000.
- Los Angeles gained 654,000 in the first half and only 99,000 in the second half. The Los Angeles CSA includes the Riverside-San Bernardino metro, which has grown rapidly in the past, but not enough to cancel out the loss in the rest of the CSA, particularly in the core Los Angeles County, which lost 69,000 Among the five counties, only Riverside and San Bernardino counties posted gains. Throughout the whole CSA, there was a 40,000 decline in 2019-2020.
- Washington-Baltimore growth dropped from 554,000 in the first half of the decade to 261,000 in the second half and only 28,000 in the last year. Washington-Baltimore (9.865 million) has displaced Chicago (9.770) as the third largest CSA. Washington-Baltimore added 815,000 new residents in the 2010s, while Chicago lost 71,000.
- Chicago added 84,000 in the first five years, but lost 155,000 in the last half. There was a loss of 50,000 in the last year. As noted above, Chicago’s CSA dropped from 3rd to 4th, now behind Washington-Baltimore.
- The San Francisco Bay CSA, which stretches nearly halfway to Los Angeles (to the Merced County/Fresno County line), added 567,000 from 2010 to 2015, but only 117,000 from 2015 to 2020. In the last year, the Bay Area experienced a 40,000 loss. The San Francisco Bay CSA (San Jose-San Francisco) grew 684,000 to 9.608 million and is challenging Chicago for third place. However, the Bay Area’s strong start in the decade morphed into a loss so at the 2019-2020 rate, it will take the Bay Area 16 years to catch Chicago.
- Boston's growth fell from 269,000 to 132,000, with the last year falling to a nominal 5,000.
- Dallas-Fort Worth did the best of the top 10, gaining 689,000 in each of the five year periods, and exceeding a 1,000,000 gain for the second decade in a row. The last year gain was 127,000. Dallas-Fort Worth, unlike its more established rivals, has experienced stable growth, with the lowest year in the decade being 110,000 and the highest 159,000.
- Houston also added more than 1,000,000 residents for the second decade in a row. In the first five years Houston’s gain was 755,000 — more than Dallas-Fort Worth. However, growth dropped to 486,000 in the last five years during the downturn in the energy industry. Houston added 92,000 in the last year, more than any CSA beside Dallas-Fort Worth and Phoenix.
- Philadelphia's growth dropped from 100,000 in the first five years to 46,000 in the second five. In the last year Philadelphia gained 3,000.
- Atlanta, hit very hard by the Great Recession, did not repeat its greater than 1,000,000 growth in this decade. In the first five years, Atlanta gained 429,000 residents, and 455,000 in the second five. Atlanta was the largest CSA to have greater growth in the second half of the decade and gained 68,000 in the last year. Atlanta passed Miami in population in 2020.
- Miami grew strongly in the first half of the decade, at 446,000, but fell to 261,000 in the second half. Growth in the last year was 21,000.
- For all its population loss reputation, Detroit gained 13,000 residents from 2010 to 2015, but dropped by 13,000 in 2015 to 2020. A 19,000 loss in the last year however suggests the area’s recovery may be limited.
- Phoenix had the best second half growth relative to the first half, increasing from 387,000 to 461,000. The 106,000 gain in the last year was second only to Dallas-Fort Worth.
- Seattle also gained more in the second half than in the first (345,000 versus 333,000) and added 51,000 in the last year.
- Orlando had a strong second half gain of 425,000 compared to its first half gain of 357,000.
The table (image and PDF link below) also contains net domestic migration data.
A Dispersing Country
Despite America’s increasing diversity, the dispersion that has generally waxed but less frequently waned since 1920.An acceleration among all CBSAs toward greater dispersion, which was covered in “Domestic Migration to Dispersion Accelerates Even Before COVID”, is the reality, even if the media, pundits and planners continue in denial.
Click here to download a PDF document with the CSA data (opens in new tab or window).
Wendell Cox is principal of Demographia, an international public policy firm located in the St. Louis metropolitan area. He is a founding senior fellow at the Urban Reform Institute, Houston, a Senior Fellow with the Frontier Centre for Public Policy in Winnipeg and a member of the Advisory Board of the Center for Demographics and Policy at Chapman University in Orange, California. He has served as a visiting professor at the Conservatoire National des Arts et Metiers in Paris. His principal interests are economics, poverty alleviation, demographics, urban policy and transport. He is co-author of the annual Demographia International Housing Affordability Survey and author of Demographia World Urban Areas.
Mayor Tom Bradley appointed him to three terms on the Los Angeles County Transportation Commission (1977-1985) and Speaker of the House Newt Gingrich appointed him to the Amtrak Reform Council, to complete the unexpired term of New Jersey Governor Christine Todd Whitman (1999-2002). He is author of War on the Dream: How Anti-Sprawl Policy Threatens the Quality of Life and Toward More Prosperous Cities: A Framing Essay on Urban Areas, Transport, Planning and the Dimensions of Sustainability.
Photo: Virginia suburbs in the Washington-Baltimore CSA, with Potomac River and Maryland in the background (by author).


