
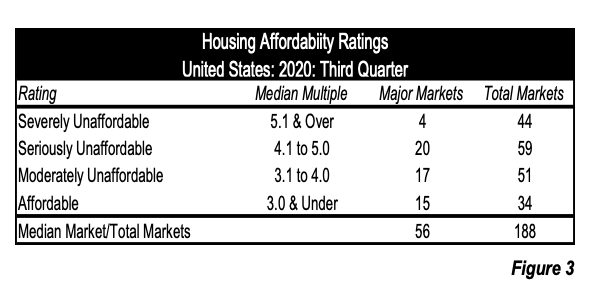
The Urban Reform Institute has published the 2021 edition of Demographia United States Housing Affordability, which rates middle-income housing affordability in the third quarter 2020. Demographia United States Housing Affordability is a supplement to Demographia International Housing Affordability, which covers 92 major housing markets (1,000,000 or more population) in 8 nations (Australia, Canada, China [Hong Kong only], Ireland, New Zealand, Singapore, the United Kingdom and the United States). The Demographia United States Housing Affordability provides ratings in 188 markets, including the 56 major metropolitan areas included in the earlier report.
Over the past year, housing affordability has deteriorated. Urban Reform Institute President Charles Blain noted: “It is not surprising that housing affordability — given the large influx of new buyers, particularly in suburban and outlying areas — has continued to deteriorate. As a result, many low-income and middle-income households who already have suffered the worst consequences from housing inflation will see their standards of living further decline.”
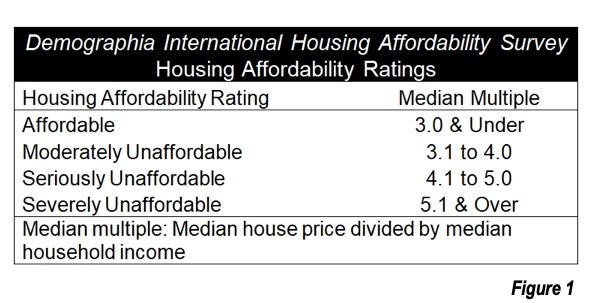
Rating Housing Affordability (The Median Multiple)
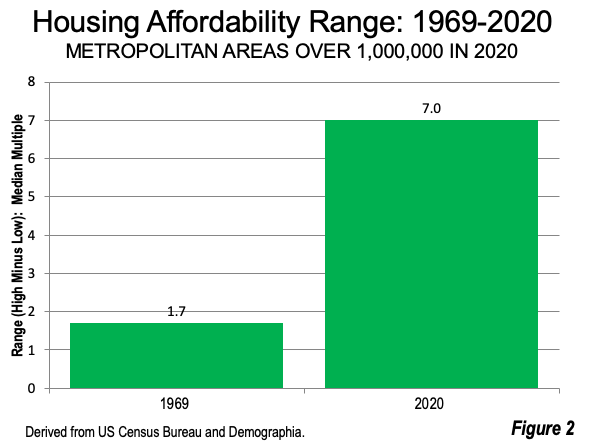
Demographia rates middle-income housing affordability in four categories, ranging from the most affordable (“affordable”) to the least affordable (“severely unaffordable”), as is indicated in Figure 1. As late as the 1990s price-to-income ratios were at or below 3.0 in Australia, Ireland, New Zealand, the United Kingdom and the United States, in markets rated “affordable. Since then, there has been a substantial divergence in affordability between major markets, which research has associated with stronger land use regulation (especially urban containment). The range between least affordable and most affordable markets rose by more than four times from 1969 to 2020 (Figure 2).
Comparing Housing Markets (Metropolitan Areas or Labor Markets)
Demographia housing affordability analyses focus on housing markets (metropolitan areas), as opposed to national metrics. Housing affordability comparisons are made: (1) between housing markets (such as comparison between the Chicago and Dallas-Fort Worth markets) or (2) over time within the same housing market (such between years in the Chicago market).
Major Markets (At Least 1,000,000 Population)
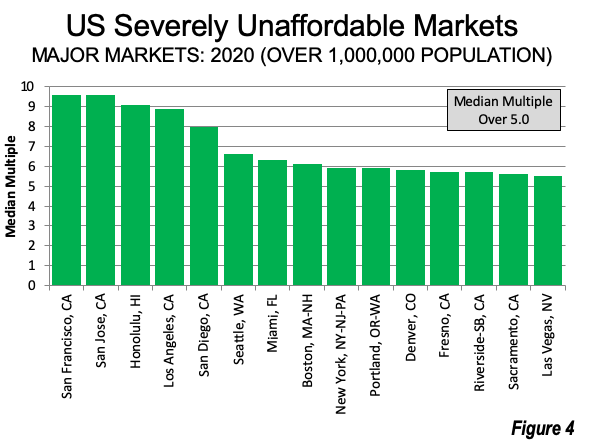
As Charles Blain noted, there was serious housing affordability deterioration in the US major markets (1,000,000 population and over) over the past year. The number of severely unaffordable markets increased from 12 to 15, including Las Vegas as well as Honolulu and Fresno, which passed 1,000,000 in population (Figure 4).
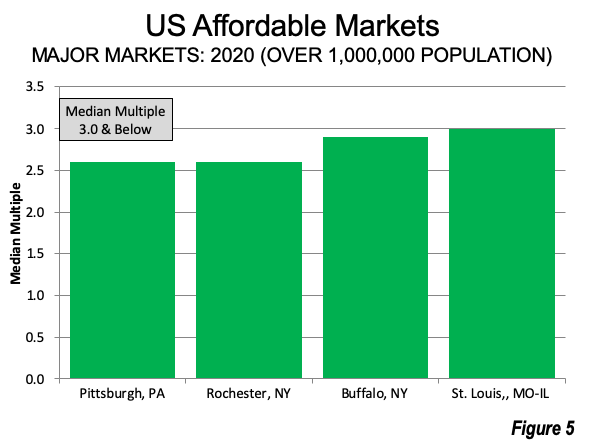
The number of “affordable” major markets declined from nine to four, reflecting the demand “shock” of the pandemic (Figure 5).
Markets Under 1,000,000 Population
Housing Markets with Less than 1,000,000 Population: Overall, 19 of the 132 U.S. housing markets with under 1,000,000 population are severely affordable (Figure 6).
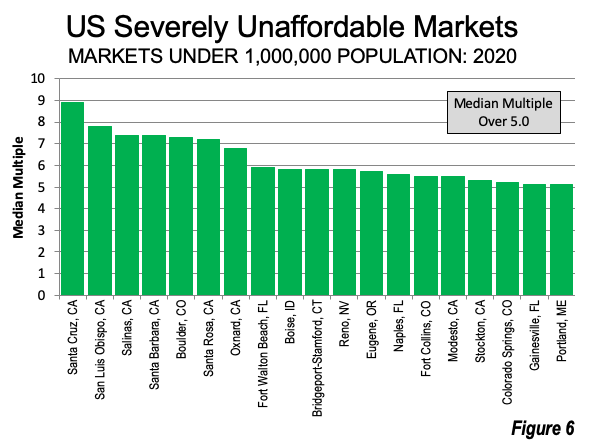
- Eight are in California: Santa Cruz (8.9), the least affordable under 1,000,000 population, as well as San Luis Obispo (7.8), Salinas (7.4) Santa Barbara (7.4) Santa Rosa (7.2) and Oxnard (6.8).Modesto (5.5) and Stockton (5.3) .
- Three are in Florida: Fort Walton Beach (5.9), Naples (5.5) and Gainesville (5.1).
- Colorado has three: Boulder (7.3), which is the least affordable outside California, along with Fort Collins (5.5) and Colorado Springs (at 5.3).
- Five states have a single severely unaffordable market, including Idaho (Boise, at 5.8), Connecticut (Bridgeport-Stamford, at 5.8), Nevada (Reno, at 5.8) Oregon (Eugene at 5.7), and Maine (Portland, at 5.1).
Affordable Markets Under 1,000,000 Population
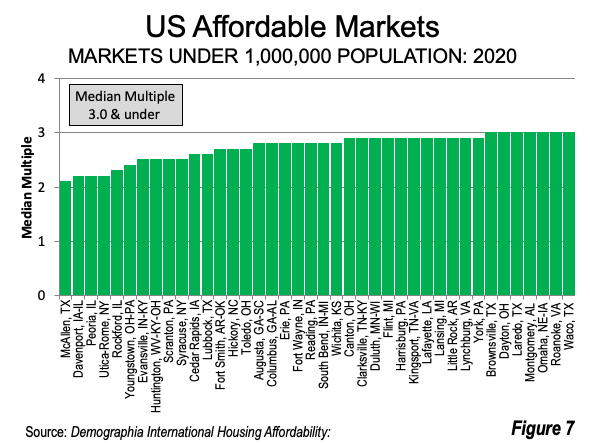
The affordable markets with less than 1,000,000 population are widely distributed among 25 states (Figure 7). This includes markets in 10 of 12 Midwest states (all but North Dakota and South Dakota), 14 of 16 states in the South (all but Florida and Mississippi) and two of three Mid-Atlantic states. No states in the West, Middle Atlantic coastal states or New England have affordable markets. The most affordable markets with a population below 1,000,000 are McAllen, TX (median multiple of 2.1), Davenport, IA-IL (2.2), Peoria, IL (2.2), Utica-Rome, NY (2.2) , Rockford, IL (2.3), Youngstown, OH-PA (2.4), as well as Evanston, IN-KY, Huntington, WV-KY-OH, Scranton, PA and Syracuse, NY, each with a median multiple of 2.5.
Urban Containment
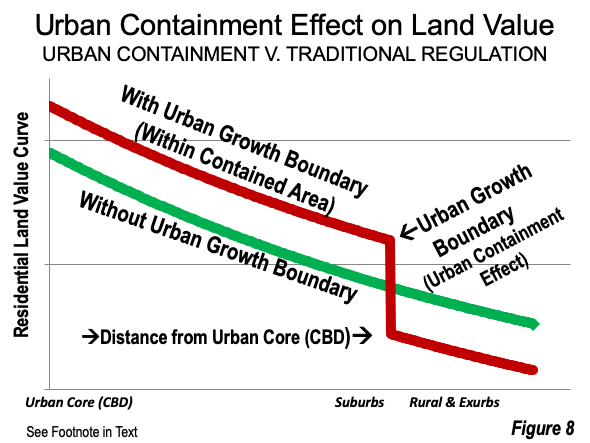
The largest differences in housing affordability between major metropolitan areas stem from the imposition of regulatory strictures that constitute “urban containment” and are often referred to as “growth management” or “compact city” policies. Urban containment applies to entire housing markets (metropolitan areas). More often than not, the severely unaffordable markets employ urban containment, which seeks to limit organic urban expansion by forbidding it, driving up housing costs (Figure 8).
One of the world’s leading urbanists, Professor Shlomo Angel, Director of the Urban Expansion Project at New York University raises concerns about prohibiting urban expansion. Angel said: ‘I’m for making room. And the reason that I’m for making room is that I’m for keeping cities affordable. And if you don’t make enough room, then cities are no longer affordable.”
Prospects
Nationally, the best housing affordability is in the South and Midwest, while the worst are located in coastal California, with severely unaffordable housing in some Mountain states markets, Miami and Northeast Corridor markets, excluding Philadelphia and Hartford. As an alternative to adopting or expanding land use restrictions that drive up prices, , responsible public officials should require evaluation of all proposed housing, land use and zoning (both regional and municipal) proposals for their potential impact on housing affordability in metropolitan areas.
The housing affordability ratings are shown in Table 3 (Page 17) and Table 4 (19) in Demographia United States Housing Affordability.
Wendell Cox is principal of Demographia, an international public policy firm located in the St. Louis metropolitan area. He is a founding senior fellow at the Urban Reform Institute, Houston, a Senior Fellow with the Frontier Centre for Public Policy in Winnipeg and a member of the Advisory Board of the Center for Demographics and Policy at Chapman University in Orange, California. He has served as a visiting professor at the Conservatoire National des Arts et Metiers in Paris. His principal interests are economics, poverty alleviation, demographics, urban policy and transport. He is co-author of the annual Demographia International Housing Affordability Survey and author of Demographia World Urban Areas.
Mayor Tom Bradley appointed him to three terms on the Los Angeles County Transportation Commission (1977-1985) and Speaker of the House Newt Gingrich appointed him to the Amtrak Reform Council, to complete the unexpired term of New Jersey Governor Christine Todd Whitman (1999-2002). He is author of War on the Dream: How Anti-Sprawl Policy Threatens the Quality of Life and Toward More Prosperous Cities: A Framing Essay on Urban Areas, Transport, Planning and the Dimensions of Sustainability.
Photo credit: Downtown Pittsburgh. The Pittsburgh housing market (metropolitan area) was, along with metro Rochester, New York the most affordable in the United States in 2020, with a median multiple of 2.6. Photo by author.


Denver is NOT affordable
But, then again, we already own our house in Denver with a zero$ mortgge.
So, do I care about affordability?
You tell me.
Dave Barnes
+1.303.744.9024