
The United States Census Bureau released its July 1, 2021 population and annual net domestic migration estimates for states and the District of Columbia on Tuesday, December 21. This article highlights trends from that release. The table at the end of the article summarizes the data.
California: Exodus Reported to be Stronger
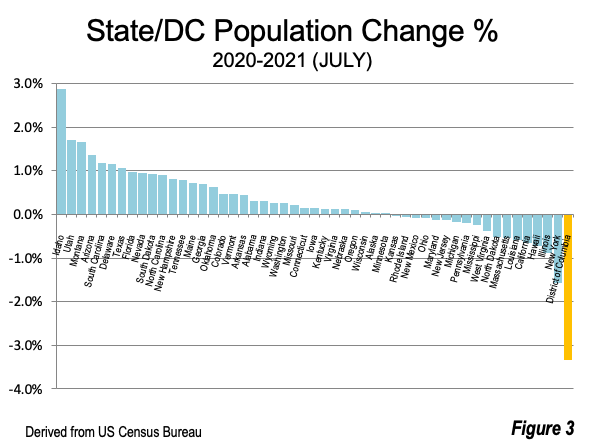
The new data was released just days after the California Department of Finance released state population and net domestic migration figures for the same period. The state release was on Friday, December 17 and we reported on that release on Monday, December 20. The Census Bureau report indicated a larger population loss and a larger net domestic migration loss (Figures 2 and 3).
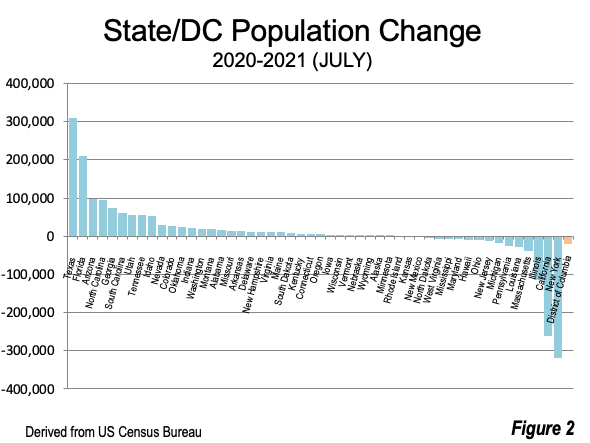
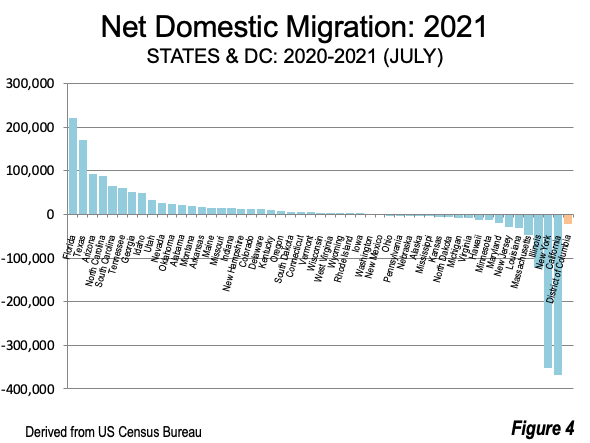
California lost 262,000 residents according to the Census Bureau, more 50% above the state’s estimate of 173,000. The Census Bureau also reported a greater net domestic migration loss, at 367,000, more than a quarter above the state estimated loss of 277,000. Both the population loss and the domestic migration loss were increased by the 56,500 Covid pandemic related deaths (Figures 4 and 5, below).
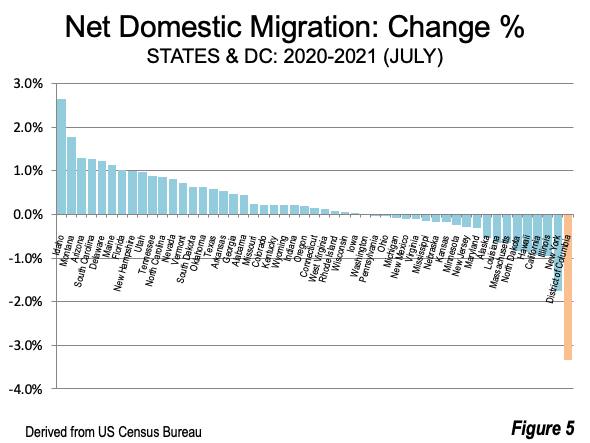
The population loss figure is the largest in California history. The domestic migration loss is the largest in the 21st century, greater than the 313,000 in 2006, as the housing bust was unfolding. The domestic migration percentage loss in 2021 was minus 0.93% (as a percentage of the 2020 population), slightly above the 2006 loss of minus 0.87%.
New York: Proportionately Worse than California
New York’s state population loss was 319,000, 22% more than the California loss. New York’s population decline was minus 1.58%, compared to minus 0.66% in California. The difference is attributable to the fact that the state of California has about twice the population of New York.
New York’s domestic migration loss was nearly equal to that of California, at minus 334,000. This is a loss of minus 1.75%, about double that of California’s 0.89%. It is an increase in net domestic migration from New York’s 2010-2020 annual average of minus 155,000.
New York, Florida and Texas
Finally, the 2020 census was the first time in history that the population of New York exceeded 20 million. The 2021 estimate indicates a drop back to 19.84 million. At the beginning of the year starting July 1, 2020, New York, the third more populous state, was 1.415 million behind number two Florida. In a single year, Florida, with the second strongest state growth (210,000) increased its margin over New York by more than 500,000, to 1.945 million. Number one Texas added 310,000 residents, the largest gain of any state.
The Northeast, Midwest and West: Moving to the South
At the regional level, all net domestic migration was to the South, compared to the previous decade when the West had net domestic migration gains in each year (Figure 1).
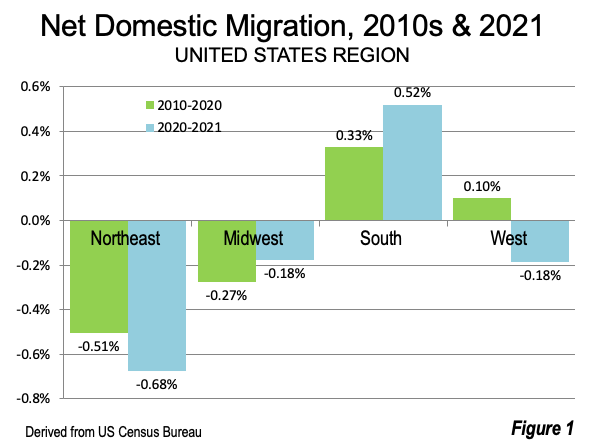
The West Falls to Equal the Rising Midwest
In an astounding development, the West fell to the Midwest level net domestic migration. That had never occurred in the annual state estimates, at least back to 2000. In 2021, the Midwest lost 0.18% of its population to net domestic migration, virtually the same as the West which stood at. By comparison, from 2010 to 2020, the Midwest lost 0.27% of its population annually to net domestic migration compared to a 0.10% annual gain in the West.
In the longer run, this could presage a demographic shift, or a rebalancing of domestic migration outside of the south and Intermountain West.
Changing Domestic Migration in the West?
Despite the West’s regional net domestic migration loss, the three strongest states in net domestic migration percentage (compared to 2020 population) also were in the West: Idaho, Utah and Montana. Altogether, these states gained 100,000 net domestic migrants. This is an increase in the total average annual domestic migration in these states of 30,000 in the 2010s.
At the same time Oregon and Washington have seen their net domestic migration plummet. Oregon, which attracted an annual average of 25,000 net domestic migrants in the 2010s, fell two-thirds, to a gain of only 8,000 in 2021. Washington, which had gained 37,000 net domestic migrants annually in the 2010s, fell to a small loss in 2021. Colorado, which averaged an annual net domestic migration gain of 38,000 in the 2010s fell by two-thirds to 13,000. Thus, Idaho, Utah and Montana, with about 6 million residents, had a 2021 net domestic migration gain nearly five times that of Washington, Colorado and Oregon, with their nearly 18 million residents.
This is another trend that could be short term or long term. However, it is not implausible that the increased opportunities in remote and hybrid work, along with the increasingly unaffordable housing in Seattle, Portland and Denver, could have contributed to the larger net domestic migration numbers in Idaho, Utah and Montana.
Remote Work Dispersion from Urban Centers?
The District of Columbia lost 23,000 net domestic migrants, and at a 3.34% loss exceeded that of New York, which at a minus 1.75% had the largest net domestic migration loss of any state. This is down from an average annual gain of 3,000 in the previous decade. This could be related to the rise of remote working and the associated dispersion away from dense urban centers this has made possible.
Interestingly, West Virginia, well within range of a remote worker spending just a few days in the month on-site, saw its net domestic migration total increase to 2,300 from its previous decade average of minus 4,600. Delaware, similarly close to Washington, as well as to Philadelphia, with the nation’s sixth largest downtown, saw its net domestic migration gain rise to 12,000, from its previous decade average of plus 5,000.
Other states in the Northeast experienced strong gains in net domestic migration that could be related to population shifts, especially from the New York City, Philadelphia and Boston employment markets (Massachusetts net domestic outmigration increased to 46,000 from its 2010s annual average loss of 19,000):
- Connecticut had 5,000 net domestic migrants, compared to an annual loss of 21,000 in the 2010s.
- New Jersey lost 28,000 net domestic migrants, down from its 52,000 annual loss in the 2010s.
- New Hampshire gained 14,000 net domestic migrants, compared to 1,000 annual previous loss.
- Vermont gained 4,600 net domestic migrants, compared with a 1,200 previous loss.
- Rhode Island gained 900 in 2021, compared to its 4,100 average previous loss.
- Maine gained 15,000 in 2021, up from its 2,000 annual gain in the 2010s.
- Pennsylvania, with good access also to the Washington market, saw its net domestic migration loss drop to 3,000 compared to the annual loss of 28,000 in the 2010s.
Net domestic migration losses in Maryland and Virginia in 2021 were similar to their 2010s averages. This means that every state from Virginia and West Virginia to Maine had a substantial improvement in net domestic migration or remained about the same , except for the big losses in New York and Massachusetts.
There are plenty of attractive places for remote workers to settle in these recently improving domestic migration states.
A More Fluid Employment and Housing Market?
The 2021 US Census Bureau population estimates indicate some new trends, highlighted above. But the game has clearly changed, and we will see how much in the next few years.
Table 1 (back to reference)
| US Census Bureau Population Estimates: July 1, 2021 | ||||||||
| US, States & DC | ||||||||
| Population in millions | Net Domestic Migration | |||||||
| 2020 | 2021 | Change | % | Number | Rank | % of 2020 | Rank | |
| United States | 331.501 | 331.894 | 0.393 | 0.12% | ||||
| REGIONS | ||||||||
| Northeast Region | 57.526 | 57.160 | -0.366 | -0.64% | -0.390 | 4 | -0.68% | 4 |
| Midwest Region | 68.935 | 68.841 | -0.094 | -0.14% | -0.123 | 2 | -0.18% | 2 |
| South Region | 126.409 | 127.225 | 0.816 | 0.65% | 0.658 | 1 | 0.52% | 1 |
| West Region | 78.631 | 78.667 | 0.036 | 0.05% | -0.145 | 3 | -0.18% | 3 |
| STATES | ||||||||
| Alabama | 5.025 | 5.040 | 0.015 | 0.30% | 0.022 | 12 | 0.44% | 19 |
| Alaska | 0.732 | 0.733 | 0.000 | 0.03% | -0.004 | 36 | -0.53% | 43 |
| Arizona | 7.178 | 7.276 | 0.098 | 1.37% | 0.093 | 3 | 1.30% | 3 |
| Arkansas | 3.012 | 3.026 | 0.014 | 0.45% | 0.016 | 14 | 0.53% | 17 |
| California | 39.500 | 39.238 | -0.262 | -0.66% | -0.367 | 50 | -0.93% | 48 |
| Colorado | 5.784 | 5.812 | 0.028 | 0.48% | 0.013 | 19 | 0.23% | 21 |
| Connecticut | 3.600 | 3.606 | 0.005 | 0.15% | 0.005 | 24 | 0.14% | 26 |
| Delaware | 0.992 | 1.003 | 0.011 | 1.16% | 0.012 | 20 | 1.23% | 5 |
| Florida | 21.570 | 21.781 | 0.211 | 0.98% | 0.221 | 1 | 1.02% | 7 |
| Georgia | 10.726 | 10.800 | 0.074 | 0.69% | 0.051 | 7 | 0.47% | 18 |
| Hawaii | 1.452 | 1.442 | -0.010 | -0.71% | -0.013 | 42 | -0.87% | 47 |
| Idaho | 1.848 | 1.901 | 0.053 | 2.88% | 0.049 | 8 | 2.65% | 1 |
| Illinois | 12.785 | 12.671 | -0.114 | -0.89% | -0.122 | 48 | -0.96% | 49 |
| Indiana | 6.786 | 6.806 | 0.020 | 0.30% | 0.014 | 17 | 0.21% | 24 |
| Iowa | 3.189 | 3.193 | 0.004 | 0.14% | 0.001 | 30 | 0.03% | 30 |
| Kansas | 2.936 | 2.935 | -0.001 | -0.04% | -0.005 | 38 | -0.18% | 39 |
| Kentucky | 4.504 | 4.509 | 0.005 | 0.12% | 0.010 | 21 | 0.22% | 22 |
| Louisiana | 4.651 | 4.624 | -0.027 | -0.58% | -0.030 | 46 | -0.65% | 44 |
| Maine | 1.362 | 1.372 | 0.010 | 0.73% | 0.015 | 15 | 1.14% | 6 |
| Maryland | 6.173 | 6.165 | -0.008 | -0.12% | -0.020 | 44 | -0.32% | 42 |
| Massachusetts | 7.022 | 6.985 | -0.037 | -0.53% | -0.046 | 47 | -0.66% | 45 |
| Michigan | 10.068 | 10.051 | -0.017 | -0.17% | -0.008 | 40 | -0.08% | 34 |
| Minnesota | 5.707 | 5.707 | 0.000 | 0.00% | -0.013 | 43 | -0.24% | 40 |
| Mississippi | 2.957 | 2.950 | -0.007 | -0.23% | -0.004 | 37 | -0.14% | 37 |
| Missouri | 6.154 | 6.168 | 0.014 | 0.22% | 0.015 | 16 | 0.24% | 20 |
| Montana | 1.086 | 1.104 | 0.018 | 1.66% | 0.019 | 13 | 1.77% | 2 |
| Nebraska | 1.961 | 1.964 | 0.002 | 0.11% | -0.003 | 35 | -0.17% | 38 |
| Nevada | 3.114 | 3.144 | 0.030 | 0.96% | 0.025 | 10 | 0.81% | 12 |
| New Hampshire | 1.378 | 1.389 | 0.011 | 0.81% | 0.014 | 18 | 0.99% | 8 |
| New Jersey | 9.280 | 9.267 | -0.013 | -0.14% | -0.028 | 45 | -0.30% | 41 |
| New Mexico | 2.118 | 2.116 | -0.002 | -0.08% | -0.002 | 32 | -0.10% | 35 |
| New York | 20.155 | 19.836 | -0.319 | -1.58% | -0.352 | 49 | -1.75% | 50 |
| North Carolina | 10.457 | 10.551 | 0.094 | 0.90% | 0.089 | 4 | 0.85% | 11 |
| North Dakota | 0.779 | 0.775 | -0.004 | -0.52% | -0.006 | 39 | -0.83% | 46 |
| Ohio | 11.791 | 11.780 | -0.011 | -0.09% | -0.003 | 33 | -0.03% | 33 |
| Oklahoma | 3.962 | 3.987 | 0.025 | 0.62% | 0.025 | 11 | 0.62% | 15 |
| Oregon | 4.242 | 4.246 | 0.005 | 0.11% | 0.008 | 22 | 0.19% | 25 |
| Pennsylvania | 12.990 | 12.964 | -0.026 | -0.20% | -0.003 | 34 | -0.02% | 32 |
| Rhode Island | 1.096 | 1.096 | -0.001 | -0.06% | 0.001 | 29 | 0.08% | 28 |
| South Carolina | 5.131 | 5.191 | 0.060 | 1.17% | 0.065 | 5 | 1.26% | 4 |
| South Dakota | 0.887 | 0.895 | 0.008 | 0.93% | 0.006 | 23 | 0.63% | 14 |
| Tennessee | 6.920 | 6.975 | 0.055 | 0.80% | 0.061 | 6 | 0.89% | 10 |
| Texas | 29.218 | 29.528 | 0.310 | 1.06% | 0.170 | 2 | 0.58% | 16 |
| Utah | 3.282 | 3.338 | 0.056 | 1.72% | 0.032 | 9 | 0.98% | 9 |
| Vermont | 0.642 | 0.646 | 0.003 | 0.48% | 0.005 | 25 | 0.71% | 13 |
| Virginia | 8.632 | 8.642 | 0.010 | 0.12% | -0.009 | 41 | -0.10% | 36 |
| Washington | 7.719 | 7.739 | 0.020 | 0.26% | 0.000 | 31 | 0.00% | 31 |
| West Virginia | 1.790 | 1.783 | -0.007 | -0.38% | 0.002 | 27 | 0.13% | 27 |
| Wisconsin | 5.892 | 5.896 | 0.004 | 0.06% | 0.003 | 26 | 0.06% | 29 |
| Wyoming | 0.577 | 0.579 | 0.002 | 0.27% | 0.001 | 28 | 0.22% | 23 |
| DC | ||||||||
| District of Columbia | 0.690 | 0.670 | -0.020 | -2.90% | -0.023 | -3.34% | ||
| Derived from US Census Bureau data | ||||||||
Wendell Cox is principal of Demographia, an international public policy firm located in the St. Louis metropolitan area. He is a founding senior fellow at the Urban Reform Institute, Houston, a Senior Fellow with the Frontier Centre for Public Policy in Winnipeg and a member of the Advisory Board of the Center for Demographics and Policy at Chapman University in Orange, California. He has served as a visiting professor at the Conservatoire National des Arts et Metiers in Paris. His principal interests are economics, poverty alleviation, demographics, urban policy and transport. He is co-author of the annual Demographia International Housing Affordability Survey and author of Demographia World Urban Areas.
Mayor Tom Bradley appointed him to three terms on the Los Angeles County Transportation Commission (1977-1985) and Speaker of the House Newt Gingrich appointed him to the Amtrak Reform Council, to complete the unexpired term of New Jersey Governor Christine Todd Whitman (1999-2002). He is author of War on the Dream: How Anti-Sprawl Policy Threatens the Quality of Life and Toward More Prosperous Cities: A Framing Essay on Urban Areas, Transport, Planning and the Dimensions of Sustainability.
Photo: New Jersey exurbs of New York (by author).


D.C.
Let's see how much of that population outflow reverses through mid-2022. Certainly the federal government isn't shrinking!