
Motor vehicles (cars, SUVs, and personal trucks) are important to national and metropolitan economies, but also the economy of households.
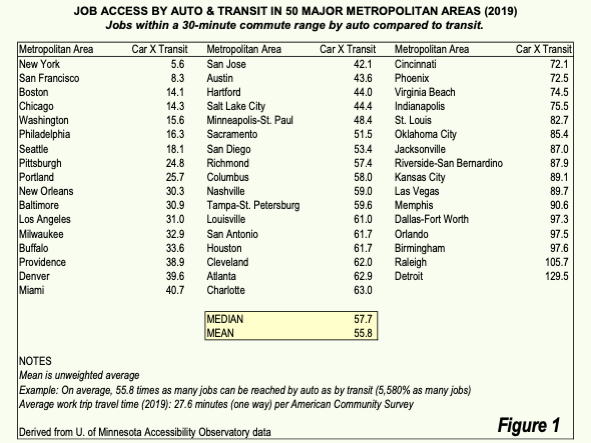
Personal vehicles largely provide the most rapid door to door trip times throughout urban areas (Chart above). Remy Prud’homme and Chang-Won Lee, University of Paris economists, along with David Hartgen and Gregory Fields at the University of North Carolina – Charlotte have shown a strong association between better economic performance in metropolitan areas where more jobs can be reached in a specified time (such as 30 minutes).
Of course, the affluence of most households depends upon employment earnings, which are likely to be higher where an employee has more jobs to choose from. Data examined from the University of Minnesota illustrates the extent to which the employment market is expanded for employees by personal vehicle access in 50 US major metropolitan areas (over 1,000,000 population. In 2019, the average car commuter in major metropolitan areas could reach 56 times as many jobs by car in 30 minutes as by transit --- that’s access to 5,600% as many jobs as by transit (Figure 1).
This article describes household access to personal vehicles, derived from the American Community Survey, 2019 and is based entirely on pre-pandemic data.
According to the latest American Community Survey (2016 to 2020), 90.5% of US households have access to a vehicle. This article describes vehicle ownership in the United States among the 56 major metropolitan areas (over 1,000,000 population), for all households, with data for home owning and renting households.
Nationally, the latest data shows that 96.9% of US home owning households have access to vehicles. Among renters, access is significantly lower, at 81.9%.
The complete data is in the table below.
Vehicle Availability All Households
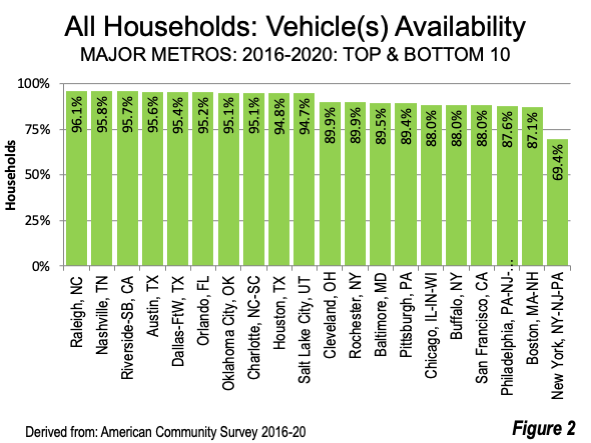
The major metropolitan areas with the 10 highest and lowest all household vehicle availability are illustrated on Figure 2. Raleigh has the highest vehicle availability at 96.1% of households. Nashville follows closely at 95.8%, with Riverside-San Bernardino, Austin, Dallas Fort Worth, Oklahoma City, Charlotte, Houston, and Salt Lake City (at 94.7%) rounding out the top 10. Eight of the top ten have auto availability of 95% or more.
The lowest automobile availability data for all household is in New York, at only 69.4%. This lower figure is attributable to the city of New York, which is naturally a special case in so many urban indicators because of its highly elevated density in four (the Bronx, Brooklyn, Manhattan, and Queens) of its five boroughs, and by far the most extensively and the most intensively used transit system. The fifth, Staten Island is typified by high suburban rather than urban core densities (Note).
The second lowest household vehicle availability is in metro Boston at 87.1% with the bottom 10 also including San Francisco, Buffalo, Chicago, Pittsburgh, Baltimore, Rochester, and Cleveland which is 10th lowest at 89.9% (Figure 2).
Vehicle Availability Among Homeowners
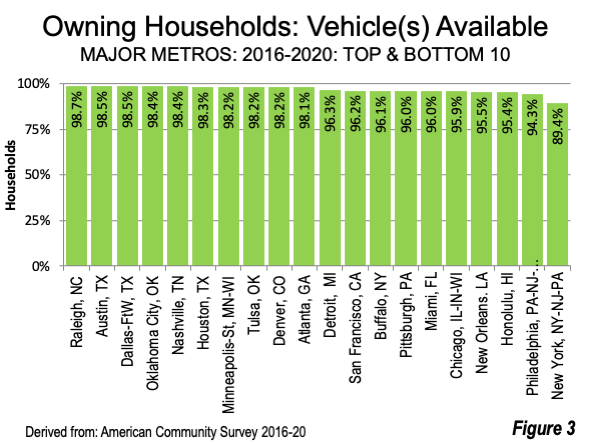
Household owning their own homes have higher vehicle availability. Raleigh also leads in this category with 98.7% of households having access to vehicles followed by Austin and Dallas-Fort Worth (at 98.5). The top ten also includes Oklahoma City Nashville, Houston, Minneapolis-St. Paul, Tulsa, Denver, and Atlanta (98.1%). All of the top 13 metropolitan areas have homeowner vehicle availability of 98.0% or more.
Again, New York has the lowest home owners vehicle availability at 89.4%, with Philadelphia second lowest at 94.3%. Other metropolitan areas in the bottom 10 include Honolulu, New Orleans, Chicago, Miami, Pittsburgh, Buffalo, San Francisco, and Detroit (96.3%). All but two of the major metropolitan areas have homeowners vehicle availability above 95% (Figure 3).
Vehicle Availability Among Renters
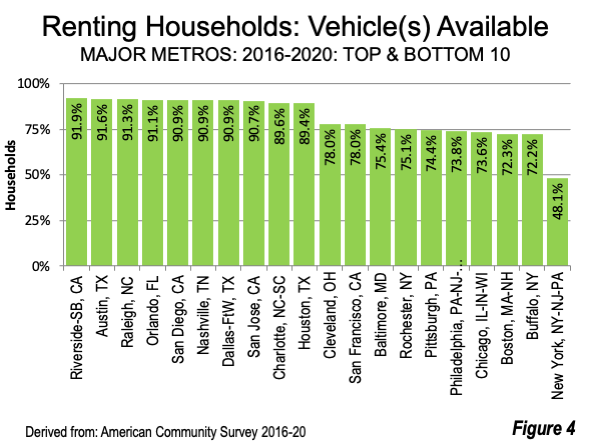
Renters have considerably less access to vehicles than those owning their own homes. The highest availability is in Riverside-San Bernardino at 91.9% followed by Austin, Raleigh, Orlando, Nashville, Dallas-Fort Worth, San Jose, Charlotte, and Houston. Even so, eight major metropolitan areas have vehicle availability exceeding 90%.
New York, again, has the lowest percentage of vehicle availability among renters at 48.1%. Second lowest Buffalo has half-again higher renter household vehicle availability at 72.2%, with Boston, Chicago, Philadelphia, Pittsburgh, Rochester, Baltimore, San Francisco and Cleveland (78.0%) rounding out the bottom 10 (Figure 4).
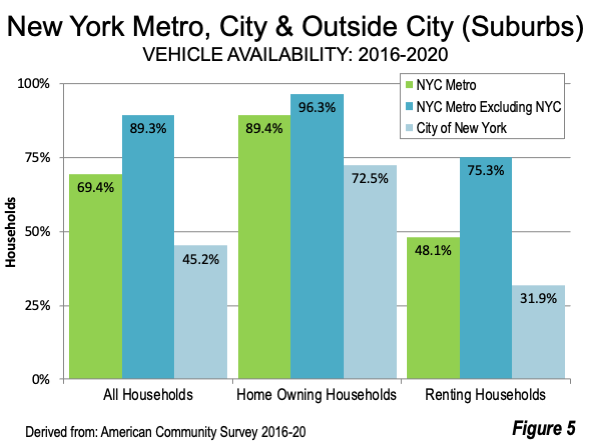
New York Outside the City
Outside the City, metro New York is much more like the other major metropolitan areas than it is like the city. The suburbs outside the city of New York are the largest suburban expanse in the nation, both in population and land area. Overall, 89.3% of suburban households have access to vehicles, a figure that would command a ranking of 51st. Among suburban homeowners, there is 96.3% vehicle access, which would rank it 46th. Among suburban renters, 75.3% have vehicle access — just below 49th ranked Baltimore at 75.4%.
And, if New York City itself were a separate metropolitan area, it would show by far the lowest vehicle availability. Overall, only 45.2% of households have vehicles available. Among homeowners, vehicle availability is 72.5%, and among renters it is 31.9% (Figure 5). Of course, what makes this possible is the nation’s most intense transit system, justified by a population density more than 10 times the national urban average. Among those commuting to jobs in New York City, 58% used transit, compared to 6.0% in the suburbs (just above the US average of 5.0%), in 2019.
Out of Poverty
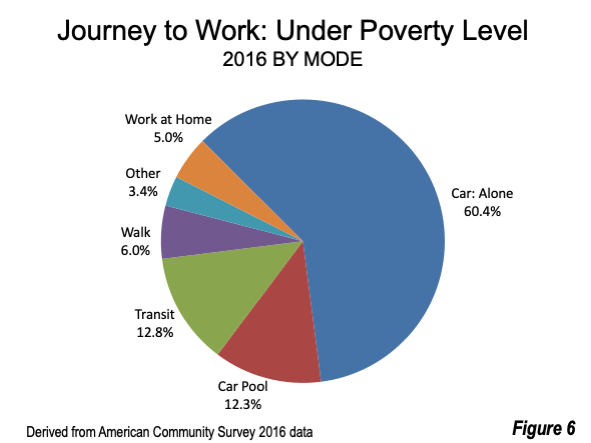
Because vehicles make so many more jobs accessible, having one available associated with lower levels of poverty. David King and associates at Arizona State University have found that households without cars are 70% more likely to be in poverty. Margy Waller of the Progressive Policy Institute found that “In most cases, the shortest distance between a poor person and a job is along a line driven in a car.”
The reality of superior employment access by personal vehicle explains their overwhelming use by workers in poverty, nearly six times the work trip share of transit (Figure 6).
Similarly, the far greater employment access provided by personal vehicles facilitates higher incomes for more affluent residents.
In my view, reducing, even eradicating, poverty, while improving affluence should be the principal purpose of domestic policy. Auto availability can prove a decisive influence on having this result.
Note (back to reference)
For example, suburban Hudson County (county seat Jersey City), New Jersey is 80% denser than Staten Island. Hudson County is directly across the Hudson River from Manhattan, stretching from south of from Battery Park to the middle of Central Park, as well as much of the Brooklyn Hudson riverfront across Upper Bay.
Wendell Cox is principal of Demographia, an international public policy firm located in the St. Louis metropolitan area. He is a founding senior fellow at the Urban Reform Institute, Houston, a Senior Fellow with the Frontier Centre for Public Policy in Winnipeg and a member of the Advisory Board of the Center for Demographics and Policy at Chapman University in Orange, California. He has served as a visiting professor at the Conservatoire National des Arts et Metiers in Paris. His principal interests are economics, poverty alleviation, demographics, urban policy and transport. He is co-author of the annual Demographia International Housing Affordability Survey and author of Demographia World Urban Areas.
Mayor Tom Bradley appointed him to three terms on the Los Angeles County Transportation Commission (1977-1985) and Speaker of the House Newt Gingrich appointed him to the Amtrak Reform Council, to complete the unexpired term of New Jersey Governor Christine Todd Whitman (1999-2002). He is author of War on the Dream: How Anti-Sprawl Policy Threatens the Quality of Life and Toward More Prosperous Cities: A Framing Essay on Urban Areas, Transport, Planning and the Dimensions of Sustainability.
Lead chart, by author.
Table (back to reference)
| Household Vehicle Availability: Major Metropolitan Areas | ||||||
| 2016/2020 | ||||||
| Population in Millions | ||||||
| Metropolitan Area | All | Rank | Owners | Rank | Renters | Rank |
| Raleigh, NC | 96.1% | 1 | 98.7% | 1 | 91.3% | 3 |
| Nashville, TN | 95.8% | 2 | 98.4% | 5 | 90.9% | 6 |
| Riverside-San Bernardino, CA | 95.7% | 3 | 97.7% | 22 | 91.9% | 1 |
| Austin, TX | 95.6% | 4 | 98.5% | 2 | 91.6% | 2 |
| Dallas-Fort Worth, TX | 95.4% | 5 | 98.5% | 3 | 90.9% | 7 |
| Orlando, FL | 95.2% | 6 | 97.7% | 25 | 91.1% | 4 |
| Oklahoma City, OK | 95.1% | 7 | 98.4% | 4 | 89.0% | 11 |
| Charlotte, NC-SC | 95.1% | 8 | 97.9% | 14 | 89.6% | 9 |
| Houston, TX | 94.8% | 9 | 98.3% | 6 | 89.4% | 10 |
| Salt Lake City, UT | 94.7% | 10 | 98.0% | 12 | 87.7% | 17 |
| San Jose, CA | 94.7% | 11 | 97.8% | 18 | 90.7% | 8 |
| Denver, CO | 94.6% | 12 | 98.2% | 9 | 88.1% | 14 |
| San Diego, CA | 94.6% | 13 | 97.7% | 23 | 90.9% | 5 |
| Phoenix, AZ | 94.6% | 14 | 97.9% | 15 | 88.5% | 13 |
| Tulsa, OK | 94.5% | 15 | 98.2% | 8 | 87.5% | 18 |
| Kansas City, MO-KS | 94.3% | 16 | 98.0% | 13 | 87.5% | 20 |
| Atlanta, GA | 94.3% | 17 | 98.1% | 10 | 87.5% | 22 |
| Indianapolis. IN | 94.2% | 18 | 98.1% | 11 | 86.7% | 24 |
| Sacramento, CA | 94.2% | 19 | 97.6% | 27 | 88.7% | 12 |
| Jacksonville, FL | 94.1% | 20 | 97.5% | 31 | 87.8% | 16 |
| Grand Rapids, MI | 93.9% | 21 | 97.8% | 20 | 83.3% | 34 |
| San Antonio, TX | 93.9% | 22 | 97.5% | 34 | 87.9% | 15 |
| Columbus, OH | 93.9% | 23 | 97.9% | 16 | 87.5% | 19 |
| Birmingham, AL | 93.8% | 24 | 97.2% | 40 | 86.2% | 25 |
| Tampa-St. Petersburg, FL | 93.6% | 25 | 96.9% | 42 | 87.3% | 23 |
| Virginia Beach-Norfolk, VA-NC | 93.4% | 26 | 97.8% | 21 | 86.0% | 27 |
| Richmond, VA | 93.3% | 27 | 97.6% | 26 | 84.6% | 31 |
| Minneapolis-St. Paul, MN-WI | 93.2% | 28 | 98.2% | 7 | 81.1% | 40 |
| St. Louis,, MO-IL | 93.0% | 29 | 97.6% | 28 | 82.6% | 37 |
| Cincinnati, OH-KY-IN | 92.7% | 30 | 97.8% | 17 | 82.3% | 39 |
| Louisville, KY-IN | 92.6% | 31 | 97.3% | 38 | 82.9% | 36 |
| Memphis, TN-MS-AR | 92.5% | 32 | 97.5% | 32 | 85.1% | 30 |
| Tucson, AZ | 92.4% | 33 | 97.4% | 36 | 83.4% | 33 |
| Los Angeles, CA | 92.2% | 34 | 97.3% | 39 | 87.5% | 21 |
| Portland, OR-WA | 92.2% | 35 | 97.7% | 24 | 83.1% | 35 |
| Fresno, CA | 92.1% | 36 | 97.6% | 30 | 85.8% | 28 |
| Miami, FL | 92.0% | 37 | 96.0% | 51 | 86.2% | 26 |
| Las Vegas, NV | 92.0% | 38 | 97.5% | 35 | 85.4% | 29 |
| Seattle, WA | 91.8% | 39 | 97.8% | 19 | 82.6% | 38 |
| Detroit, MI | 91.5% | 40 | 96.3% | 47 | 80.4% | 42 |
| Hartford, CT | 91.2% | 41 | 97.6% | 29 | 78.6% | 46 |
| Milwaukee,WI | 90.7% | 42 | 97.5% | 33 | 80.6% | 41 |
| Providence, RI-MA | 90.6% | 43 | 97.4% | 37 | 79.6% | 44 |
| Honolulu, HI | 90.5% | 44 | 95.4% | 54 | 83.9% | 32 |
| Washington, DC-VA-MD-WV | 90.2% | 45 | 96.6% | 44 | 78.8% | 45 |
| New Orleans. LA | 89.9% | 46 | 95.5% | 53 | 80.1% | 43 |
| Cleveland, OH | 89.9% | 47 | 96.4% | 45 | 78.0% | 47 |
| Rochester, NY | 89.9% | 48 | 97.2% | 41 | 75.1% | 50 |
| Baltimore, MD | 89.5% | 49 | 96.6% | 43 | 75.4% | 49 |
| Pittsburgh, PA | 89.4% | 50 | 96.0% | 50 | 74.4% | 51 |
| Chicago, IL-IN-WI | 88.0% | 51 | 95.9% | 52 | 73.6% | 53 |
| Buffalo, NY | 88.0% | 52 | 96.1% | 49 | 72.2% | 55 |
| San Francisco, CA | 88.0% | 53 | 96.2% | 48 | 78.0% | 48 |
| Philadelphia, PA-NJ-DE-MD | 87.6% | 54 | 94.3% | 55 | 73.8% | 52 |
| Boston, MA-NH | 87.1% | 55 | 96.3% | 46 | 72.3% | 54 |
| New York, NY-NJ-PA | 69.4% | 56 | 89.4% | 56 | 48.1% | 56 |
| Derived from American Community Survey 2016-2020 | ||||||


