
Like many of the world’s largest cities (Note 1), public policy seeks to densify Toronto, which is already the densest urban area (the international term) or population centre (the Canadian term) in North America (as used here, north of Mexico). An urban area is continuously built up urbanization and is routinely at the core of a metropolitan area (in Canada, a Census Metropolitan Area, or CMA). In Toronto, the population centre occupies 31% of the CMA land area, while the rest of the CMA --- 69% of the land, principally rural, is outside the population centre.
Densification from 2016 to 2021
Toronto is densifying, but perhaps not as much as the public may have been led to believe. At the previous census (2016), the Toronto population center had a density of 3,028 per square kilometer (7,843 per square mile). This is 12% above Los Angeles, the second densest urban area in Northern America (2010). Perhaps more surprisingly the Toronto populaation center is 48% denser than New York. New York may be everyone’s favorite density champion, but it is the least dense megacity in the world.
By 2021, the Toronto population center had risen to a density of 3,088 per square kilometer (7,997 per square mile), an increase of 2.0%.
Overall, the Toronto CMA added 274,000 residents, a gain of 4.6% from the 2016 population. The Toronto population center added 218,000 residents, an increase of 4.0%.
Where the Densification Occurred
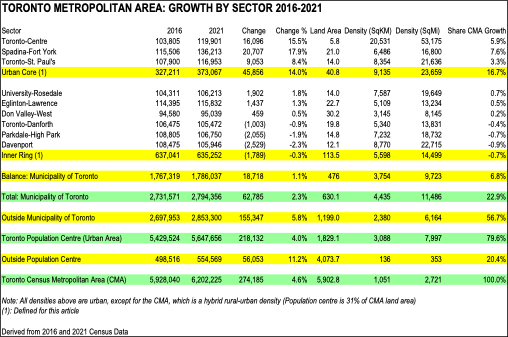
The table below summarizes the change in population in the Toronto CMA by sector.
Urban Core Densification: The largest percentage gain occured in the centre of Toronto, in three federal electoral districts, which are defined for this article as the urban core (Note 2). The urban core added 46,000 residents, an increase of 14.0%. This is more than three times the CMA population increase rate.
The largest increase was in the Spadina-Fort York electoral district, with an increase of 17.9%. nearly four times the CMA increase. Spadina-Fort York includes the municipality of Toronto City Hall and has a population density of 6,485/16,800.
Toronto-Centre had an increase of 15.5% and has by far the highest population density among the federal electoral districts in the CMA. At 20,531/53,175, Toronto Centre is about as dense as the ville de Paris, but about a quarter less dense than New York’s Manhattan. But, Toronto-Centre covers a much smaller land area, at 5.88 square kilometers. Manhattan is about 10 times as large (59 square kilometers) and Parisis about 18 times as large (105 square kilometers).
The third urban core federal electoral district, Toronto-St. Paul’s, gained 8.4% from 2016 to 2021.
However, the federal electoral districts that border on the urban core (defined herein as the “inner ring”) gained only modestly or even lost population over the past five years. These six districts had a net loss of 1,800 residents and a decline of 0.3%.
Municipality of Toronto: Outside the Urban Core
Outside the urban core and inner ring, the municipality of Toronto gained 19,000 residents, or 1.1%. This is less than a quarter of the CMA increase rate.
Population Center Outside the Municipality of Toronto (the Suburbs)
The third largest percentage gain was in the suburbs — the area between the Toronto municipality limits and the outer edge of the population centre. The suburbs 155,000 added residents, a 5.8% increase from 2016. The suburbs had an urban density of 2,380 per square kilometer or 6,164 per square mile.
This area includes Mississauga, the largest suburb in Canada, with a population of 718,000. Mississauga has experienced substantial high density development over the past decade (Photo above), yet its population increased only 0.6% since 2011, including a 0.5% loss between 2016 and 2021.
Metropolitan Area Outside the Population Centre (the Exurbs)
Yet the big growth, as around US metropolitan areas, has been in the suburbs and exurbs. The second largst percentage increase in population occurred between the population center and the CMA boundary. Here there was an increase of 56,000 residents, an increase of 12.0% over the five years. The population density of this principally rural sector was 136 per square kilometer (353 per square mile). Some of the land is urban, such as the Milton and Orangeville population centres.
Distribution of Population Growth
The suburbs and exurbs accounted for 77.1% of the CMA population growth between 2016 and 2021. The municipality of Toronto accounted for 22.9% of the CMA growth (Figure 1).
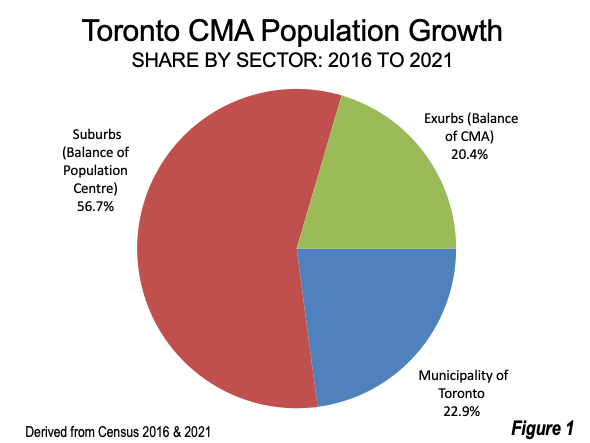
While the exurbs had the smallest share of the growth, they attracted one-fifth more than in the densifying urban core (56,000 versus 49,000).
In the 2021 census, the municipality of Toronto fell to less than one-half (49.5%) the population of the population centre and now has 45.1% of the CMA population.
Moreover, despite Toronto’s strong percentage growth in the urban core, it was small compared to the growth of the Toronto population centre and the Toronto CMA. Overall, only 17% of the CMA population growth was in the urban core.
A Tough Environment for Densification
One of the principal purposes of densification is to reduce auto use by enticing drivers to commute by transit instead. Yet there has been little progress on this front, as auto use and traffic congestion have increased.
This is because, for most trips, whether in Toronto, New York or Paris, autos provide greater mobility. International research indicates that the average Toronto CMA resident can reach 4.5 times as many jobs by car as by transit in 30 minutes (calculated from source). Thirty minutes is used as a standard for one-way commuting in a number of metropolitan areas.
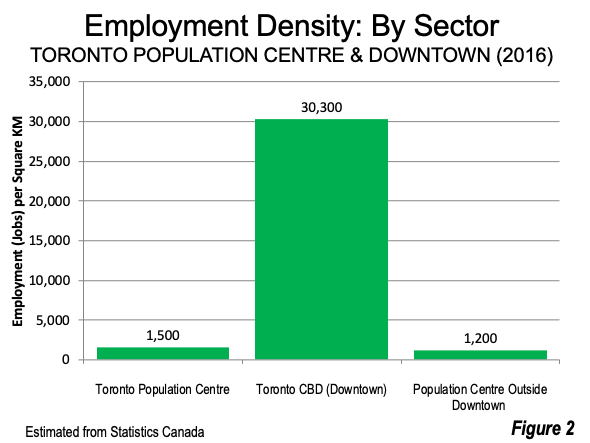
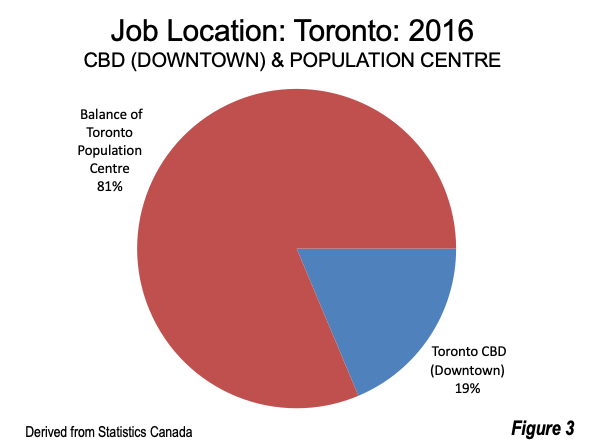
Toronto, and all major metropolitan areas in North America, are widely dispersed. Transit can effectively serve concentrated employment, principally downtown (the central business district or the CBD). Toronto’s downtown employment density is estimated at 30,300 per square kilometer, more than 25 times that of the rest of population centres (Figure 2). Only 19% of employment in the Toronto population centre was downtown in 2016, (estimated from Statistics Canada data). The other 81% of jobs was outside downtown and far more accessible by cars (Figure 3).
Downtown’s transit concentration is illustrated byToronto’s extensive suburban rail system. Metrolinxis the second largest in North America, trailing much larger New York. Nearly all trips begin or end (96%) at downtown’s Union Station.
A New World?
The pandemic has resulted in fundamental changes in urban areas.
Remote and hybrid work have reduced auto use far more than could have been realistically expected by attracting drivers to transit. As of May 2022, the Labor Force Survey indicated that remote and hybrid work remained above 25%, more than double the pre-pandemic share of transit commuting, as reported in the 2016 census.
Meanwhile, transit ridership has been decimated. In 2021, Metrolinx carried at least 80% fewer riders than in 2019, ridership, while the Toronto Transit Commission, the subway operator, had seen its ridership drop more than 60%.Moreover, Toronto’s substantial net outmigration to more affordable markets around Ontario has been associated with its rapidly deteriorating housing affordability.
This new world makes densification even more challenging.
Note 1: This article refers to the generic forms of the city, the metropolitan area and the “population center,” which is the Statistics Canada term for “urban area”).
Note 2: Canada’s federal electoral districts provide an effective means for obtaining data that is masked in the largest municipalities (such as the municipality of Toronto). Each federal electoral district elects one of the 338 members to Canada’s House of Commons. With a national population of 37.0 million in 2021, the average federal electoral district had approximately 109,000 residents.
Also See:
Suburbanizing Canada: The 2021 Census
Comparing Urban Densities: Winnipeg and New York
Toronto Solidifies Highest Density Ranking in North America
Canada, US Cities with Largest CBDs Lost Population
Wendell Cox is principal of Demographia, an international public policy firm located in the St. Louis metropolitan area. He is a founding senior fellow at the Urban Reform Institute, Houston, a Senior Fellow with the Frontier Centre for Public Policy in Winnipeg and a member of the Advisory Board of the Center for Demographics and Policy at Chapman University in Orange, California. He has served as a visiting professor at the Conservatoire National des Arts et Metiers in Paris. His principal interests are economics, poverty alleviation, demographics, urban policy and transport. He is co-author of the annual Demographia International Housing Affordability Survey and author of Demographia World Urban Areas.
Mayor Tom Bradley appointed him to three terms on the Los Angeles County Transportation Commission (1977-1985) and Speaker of the House Newt Gingrich appointed him to the Amtrak Reform Council, to complete the unexpired term of New Jersey Governor Christine Todd Whitman (1999-2002). He is author of War on the Dream: How Anti-Sprawl Policy Threatens the Quality of Life and Toward More Prosperous Cities: A Framing Essay on Urban Areas, Transport, Planning and the Dimensions of Sustainability.
Photograph: Absolute World condominiums (56 and 50 floors), in Mississauga, Canada’s largest suburb by Sarbjit Bahga via Wikimedia, CC 4.0 License.


