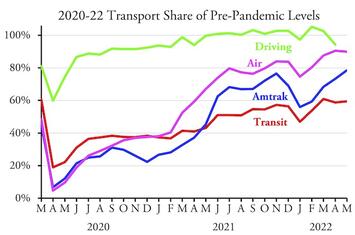
Transit ridership remained below 60 percent of pre-pandemic levels in May 2022, according to data released by the Federal Transit Administration recently. This was only a slight improvement over April’s 58.7 percent despite average fuel prices climbing from a little over $4 in April to more than $4.50 in May.
Amtrak passenger miles, meanwhile, reached 78.5 percent of May 2019, a 5 percent climb from April. Air travel remained right around 90 percent of pre-pandemic levels. Driving data will be released later this month.
As in previous months, commuter bus and commuter rail are still doing poorly, carrying 37.2 percent and 48.7 percent of pre-pandemic numbers. Heavy rail carried 58.3 percent of pre-pandemic riders, light rail 60.9 percent, and conventional buses (which the FTA calls “motor bus”) 61.9 percent. The only form of urban transit to breach 70 percent was inclined planes, which are mostly for tourists, at 75.7 percent.
When compared with April 2022, May ridership grew by only 2.1 percent. A small amount of growth in May is typical; May 2018 ridership was 3.6 percent greater than April while in 2019 it was 1.0 percent greater. Thus, the 2.1 percent growth in 2022 is simply seasonal and not a reflection of transit recovering from the pandemic.
It seems increasingly likely that transit ridership has reached a plateau of about 60 percent of pre-pandemic numbers. That’s worse than I had predicted, as I estimated ridership would recover to no more than 75 percent of pre-pandemic levels based on increased telecommuting and dispersal of jobs from downtowns and residents to smaller cities and exurban areas. Transit’s inability to capitalize on high fuel prices is particularly foreboding.
As usual, I’ve posted an enhanced version of the FTA’s spreadsheet. It includes annual (from 2002 through 2022) ridership and vehicle-revenue mile totals in columns IU through JO, mode totals in rows 2265 through 2285, agency totals in rows 2291 through 3289, and urban area totals in rows 3296 through 3783.
This piece first appeared at The Antiplanner.
Randal O'Toole, the Antiplanner, is a policy analyst with nearly 50 years of experience reviewing transportation and land-use plans and the author of The Best-Laid Plans: How Government Planning Harms Your Quality of Life, Your Pocketbook, and Your Future.
Graph: While airline and Amtrak numbers grew in April (as a percent of 2019 levels), transit numbers fell.


Why So Few Drivers are Driven to Transit by High Gas Prices
The problem is that transit is not a substitute for driving. Research indicates that among 50 metropolitan areas with more than 1,000,000 population, on average cars can provide access to more than 55 times as many jobs as transit in 30 minutes. Even in the New York metro area, with an incomparable transit system, cars can provide access to about 6 times as many jobs as transit.
https://www.newgeography.com/content/007252-auto-30-minute-commutes-subs...
Wendell Cox
Demographia
www.demographia.com