Canada, like virtually all regions classified as “more developed” by the United Nations (Europe, Canada, the United States, Japan, Australia and New Zealand) is experiencing a dropping birth rate. The favored international indicator is the total fertility rate (TFR), the number of children that the average woman has during her child-bearing years.
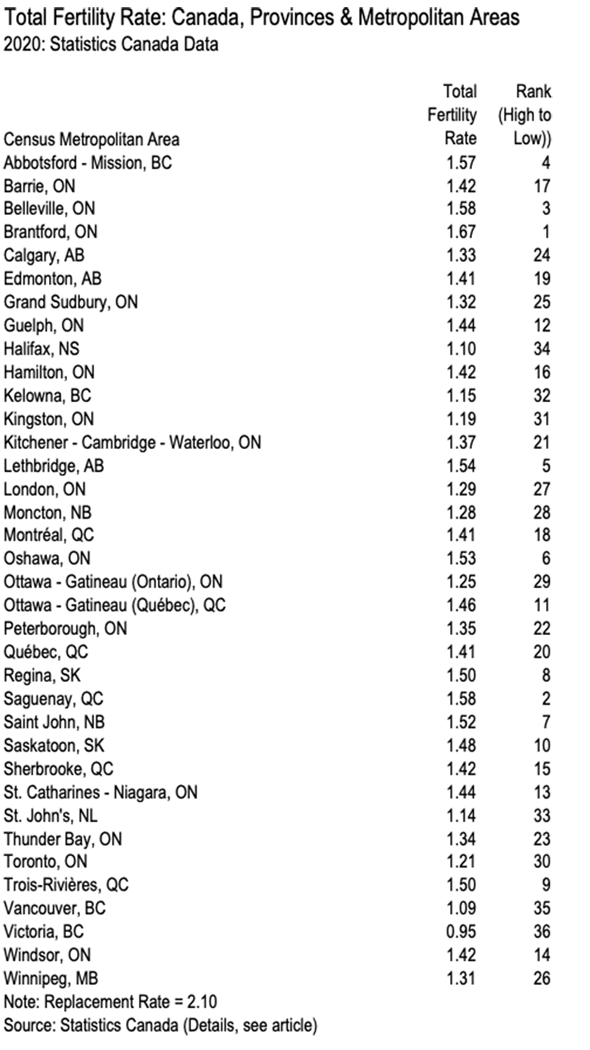
The data for TFRs for Canada, the provinces and territories and the census metropolitan areas (CMAs) for 2020 was obtained from Statistics Canada (Note: Source), by Professor Don Kerr of Western University (University of Western Ontario), which he kindly provided. The Statistics Canada data, covers 36 CMAs (with Ottawa-Gatineau [ON-QC] separated into its Ontario and Quebec parts).
According to Statistics Canada, Canada’s TFR dropped to a record low of 1.40 in 2020, down from 1.47 in 2019. By comparison, overall the regions designated as “more developed” by the United Nations had a TFR of 1.51, very close to Canada’s rate. Australia had a higher TFR of 1.59 and the United States 1.64. A replacement rate TFR of 2.10 is required to maintain a nation’s population level, all things being equal.
Provinces and Territories
There is a wide variation in TFR among the provinces and territories (Figure 1). British Columbia has the lowest TFR, at 1.18. The four Atlantic provinces are among the six with the lowest TFRs, including Nova Scotia (1.24), Newfoundland and Labrador (1.26), Prince Edward Island (1.33) and New Brunswick (1.42). Ontario ranks fifth lowest, with a TFR of 1.34.
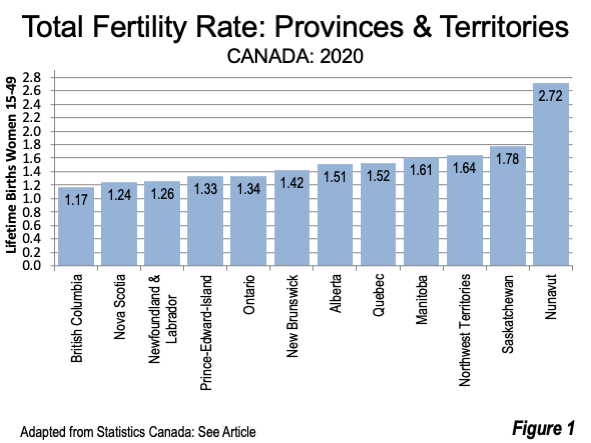
TFRs are somewhat higher in the Prairies, with 7th ranked Alberta, at 1.51, Manitoba, at 1.61 and Saskatchewan at 1.78. Quebec has a TFR of 1.52 and the Northwest Territories is at 1.64. Nunavut (territory) has by far the highest reported TFR, at 2.72 and is the only provincial level jurisdiction with an above replacement rate (2.10). Data was not reported for the Yukon (territory).
Major Metropolitan Area TFRs
Among the six major metropolitan areas (over 1,000,000 population), Vancouver has the lowest TFR, at 1.09. Toronto has a TFR of 1.21, ranked seventh lowest overall. The Ontario portion of Ottawa-Gatineau (with about three-quarters of the metropolitan area population) has a TFR of 1.25, ranked eighth lowest. Calgary, at a TFR of 1.33 and ranks 13th lowest overall. Edmonton and Montreal are tied at 18th lowest overall, with a TFR of 1.41. The Quebec portion of Ottawa-Gatineau has a TFR of 1.46, ranking 26th lowest.
While no overall Ottawa-Gatineau figure was reported, a “ball park” TFR can be estimated at about 1.30 based on population weighting (2020 estimates). This would produce an overall 11th ranking for the entire metropolitan area.
All six of the major metropolitan areas have a below replacement rate TFR, ranging from Vancouver’s 1.09 to Montreal and Edmonton at 1.41 (and likely Ottawa-Gatineau at about 1.30). Each of the six major metropolitan areas has a TFR below the lowest (San Francisco, at 1.49) of the 56 major metropolitan areas in the United States (Note: Metropolitan Areas).
Overall Metropolitan Area Rankings
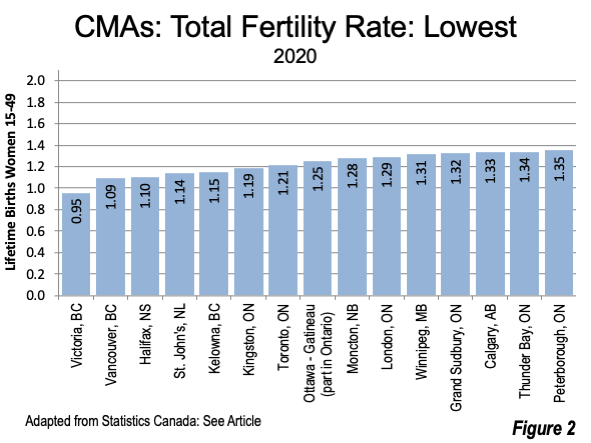
Among all CMA’s, Victoria has the lowest TFR, at 0.95 (see Table). International metropolitan area TFRs are not routinely reported, but from the rates we have identified, the Victoria CMA seems likely to be among the lowest.The World Bank data estimates the 2020 Hong Kong TFR at 0.87, while Singapore, long known for its low fertility rate is at 1.10. Some metropolitan areas, however are reported to be even lower, with Shanghai and Beijing reported around 0.70 and Seoul at 0.73.
In addition to nearby major metropolitan Vancouver, four other CMAs have TFRs below 1.20, including (in order) Halifax (1.10), St. John’s (1.14), Kelowna (1.15) and Kingston (1.19). Along with majors Toronto and Ottawa-Gatineau (ON), two additional CMAs have TFRs under 1.30, Moncton (1.28) and London (1.29). Major metropolitan area Calgary and five other CMAs have TFRs below the national rate of 1.40, including Winnipeg (1.31), Sudbury (1.32), Thunder Bay (1.33), Peterborough (1.35) and Kitchener-Cambridge-Waterloo (1.37). Often referred to as Canada’s Silicon Valley, Kitchener-Cambridge-Waterloo has a TFR lower than that of California’s original Silicon Valley, which sprawls over San Jose (1.59) and San Francisco (Figure 2).
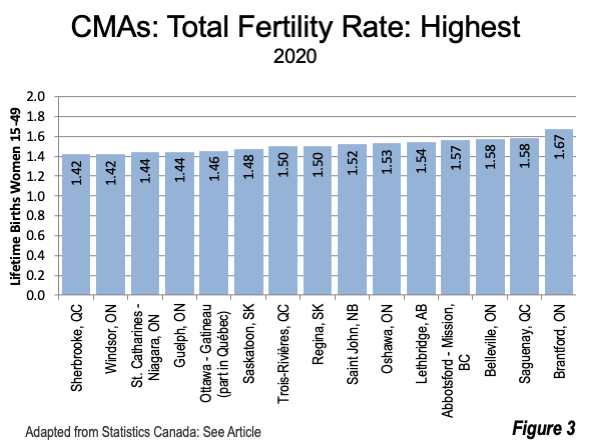
The highest TFR is in Brantford, at 1.67, well below the replacement rate of 2.10 (Figure 3). The second highest TFR is in Saguenay and Belleville, at 1.58. Six other CMAs have TFRs of 1.50 and above, Abbotsford-Mission (1.57), Lethbridge (1.54), Oshawa (1.53), Saint John (1.52), as well as Regina and Trois-Rivieres (1.50).
Comparison of Major and Smaller CMAs
The major CMAs have, with an average TFR of 1.29, lower than the 1.39 of the smaller CMAs. Both averages are below the national TFR of 1.40. Overall, the TFR in the rest of the nation is greater though there is no immediately available figure.
Part of the reason for higher TFRs outside the major metropolitan areas is lower house prices that attract younger households. This is especially true in British Columbia and Ontario, where there has been considerable net outmigration away from most unaffordable Vancouver and Toronto to other CMAs in the same provinces.
A Challenging Future
According to the United Nations World Population Prospects and Vienna’s Wittgenstein Centre the prospect is for world population to peak later in the century and then begin to drop. It is already dropping in Japan and is expected to soon decline in China, where with its current TFR of 1.18, the population could fall by 650 million by 2100. Canada is expected to continue growing, but at a much slower rate than in recent decades. This growth is expected to be largely from immigration.
Sitting in traffic congestion on Toronto’s “401” (MacDonald Cartier Freeway) or in other crowded situations, one might be tempted to applaud the looming slower population growth and declines. However, the nature of this population change creates substantial challenges. Not the least is that the population will get older, and newer generations smaller. The resulting much smaller workforce is likely to be hard pressed to pay the taxes required for the much greater social welfare needs of the larger older cohorts. This does not bode well for a world, and Canada, both of which already face a cost of living crisis.
Note: Source — Adapted from Statistics Canada, “Total Fertility Rate (live births) (children per woman), 2020, Census Metropolitan Areas (CMAs) Censusand Non-CMACAs, Canada: Standard Geographical Classification 2016.” This does not constitute an endorsement by Statistics Canada of this product.
Note: Metropolitan Areas — Criteria for delineating metropolitan areas varies by nation.
Wendell Cox is principal of Demographia, an international public policy firm located in the St. Louis metropolitan area. He is a founding senior fellow at the Urban Reform Institute, Houston, a Senior Fellow with the Frontier Centre for Public Policy in Winnipeg and a member of the Advisory Board of the Center for Demographics and Policy at Chapman University in Orange, California. He has served as a visiting professor at the Conservatoire National des Arts et Metiers in Paris. His principal interests are economics, poverty alleviation, demographics, urban policy and transport. He is co-author of the annual Demographia International Housing Affordability Survey and author of Demographia World Urban Areas.
Mayor Tom Bradley appointed him to three terms on the Los Angeles County Transportation Commission (1977-1985) and Speaker of the House Newt Gingrich appointed him to the Amtrak Reform Council, to complete the unexpired term of New Jersey Governor Christine Todd Whitman (1999-2002). He is author of War on the Dream: How Anti-Sprawl Policy Threatens the Quality of Life and Toward More Prosperous Cities: A Framing Essay on Urban Areas, Transport, Planning and the Dimensions of Sustainability.
Photo: Vancouver: Major metropolitan area with lowest total fertility rate in Northern America (Canada and the United States). Photography by author.
Table 1(back to text)