
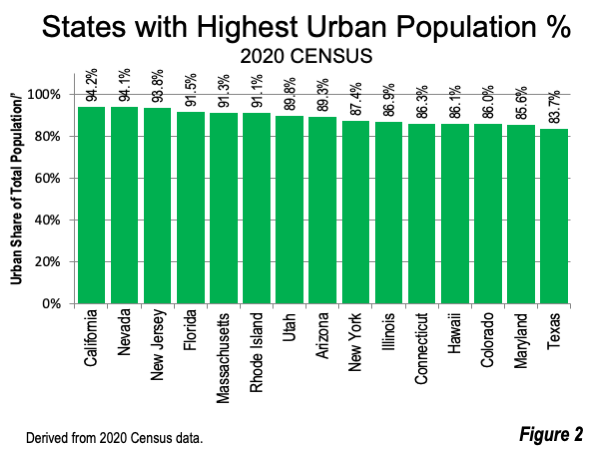
The 2020 Census reveals California to have both the highest urban population density and the highest urbanization share of total population among the states. The urban areas of California have a population density of 4.790 per square mile, above second ranked New York, at 4,645. A total of 94.2% of California residents live in urban areas, slightly above number two Nevada, at 94.1%.
This reflects a substantial change in the Census Bureau’s urban versus rural definition. From 1910 to 2010, urbanization was defined as settlements of 2,500 or more residents.From 1950 to 1990, larger areas of continuous urbanization were designated as “urbanized areas” based on density criteria. The “building blocks” of “urbanized areas” before 2000 were municipalities. Sometimes these municipalities included substantial undeveloped land (such as Los Angeles, which extended through the wilderness to the crest of the San Gabriel Mountains or New Orleans with its eastern wetlands extension). Further, settlements that did not qualify as “urbanized areas” could qualify under the minimum population criteria of 2,500.
In 2000, the Census Bureau started delineating continuously developed urban areas by computer, using the smallest census geography, the census block. This eliminated largely undeveloped areas like the Los Angeles and New Orleans cases referenced above. Overall, an urban area had to have a density of 2,500 or more. This rendered the urbanized areas of 2000 and 2010 incomparable with those before.
In 2020, a further revision required urban areas to meet either a 5,000 population or a 2,000 housing unit criteria as well as other changes. The actual urban areas are built up from census blocks using housing rather than population densities.
In 2020, the urban population of the United States was 265.2 million, 80.0% of the total. This is up from 249.3 million in 2010, when the urban population share was 80.7% of the population. The small decline in the urban percentage resulted principally from the revised density criteria.
The table below summarizes elements of urban density by state.
Highest Urban Density and Urbanization
The top 15 states in urban population density and percentage of urbanization are illustrated in Figures 1 and 2.
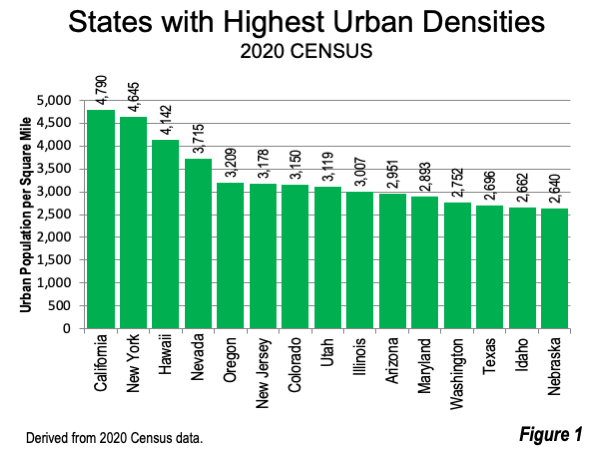
Nine of the 15 states with the highest urban densities are located in the west, including California, Hawaii, Nevada, Oregon, Colorado, Utah. Arizona, Washington and Idaho.
California, with the densest urbanization, has 70 of the 100 densest urban areas. California also has 35 of the 43 urban areas (81%) with population densities exceeding 5,000. California has the three densest urban areas with more than 500 ,000 population.
New York, with the second densest urbanization in the nation (4,645 per square mile), is largely driven by the part of the New York urban area in the state. New York state ranks ninth in the percentage of its population living in urban areas.
Hawaii has the third densest urbanization, largely due to the Honolulu urban area, which ranks fourth in density among the urban areas over 500,000 population (5,886).
Nevada has the fourth densest urbanization, at 3.715 per square mile, driven by Las Vegas, the sixth densest urban area, with 5,046 per square mile. The Las Vegas urban area has 71 percent of Nevada’s population.
Oregon has the fifth densest urbanization, at 3,209 per square mile. The Portland urban area most of which is located in Oregon has a density of 4,052, ranking 13th among the urban areas with more than 500,000 population.
New Jersey has the sixth densest urbanization (3,178), with largely suburban development in the New York and Philadelphia urban areas. New Jersey ranks third in its percentage of population in urban areas, at 93.8%.
Colorado has the seventh densest urbanization (3,119) where Denver, with about 4,200 per square mile ranking 11th out of those over 500,000.
Utah has an urban density of 3,119 per square mile, the ninth highest. Utah has the seventh highest percentage of its residents living in urban areas, at 89.8%.
Illinois has the tenth densest urbanization, at 3,007 per square mile. Illinois also has the 10th highest urbanization rate, at 86.9%.
Lowest Urban Density and Urbanization
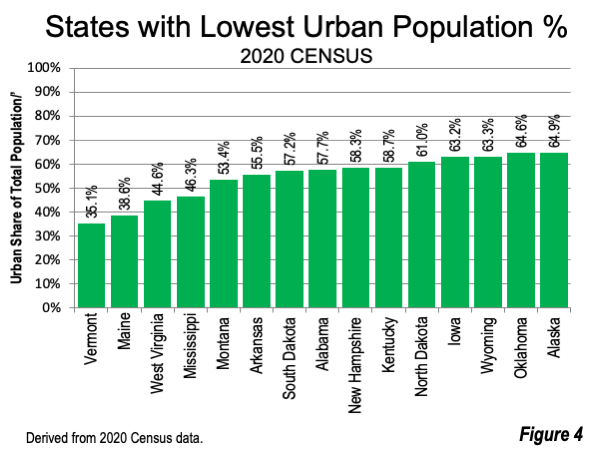
The 15 states with the lowest urban population density and percentage of urbanization are illustrated in Figures 3 and 4.
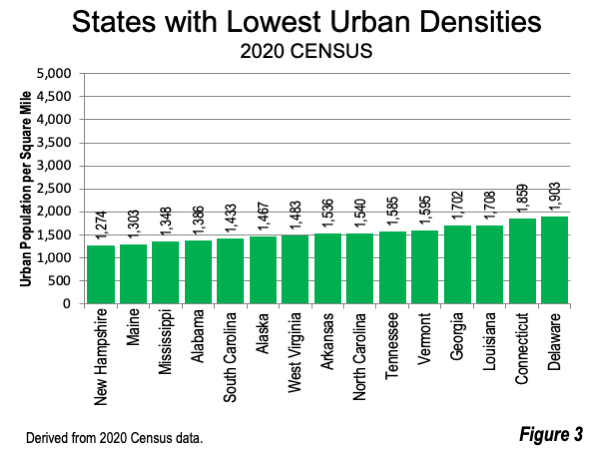
The states with the lowest urban population densities are in the Northeast and South. New Hampshire has the lowest density, at 1,274 per square mile. Much of the state is in the Boston-Worcester-Providence, MA-RI-NH-CT combined statistical area, including its largest city (Manchester). New Hampshire also has the ninth lowest urban population share, at 58.3 percent.
Maine, adjacent to New Hampshire has similar urban population characteristics, with the second lowest urban population density (1.303) and the second lowest urbanization, at 38.6 percent of the population.
Mississippi, Alabama and South Carolina are ranked third through fifth in urban density. Mississippi has the fourth lowest urbanization rate.
Only one western state, Alaska, is among the states with the 5th lowest urban density. Two eastern states, Vermont and Connecticut also have among the lowest urban densities.
Seven of the 15 states with the lowest urban densities are in the south, including West Virginia, Arkansas, North Carolina, Tennessee, Georgia, Louisiana and Delaware. North Carolina and Georgia are particularly notable, as two of the fastest growing states, both of which have recently reached a population of 10 million.
Vermont is the least urbanized state, with only 35.1 percent of its population in urban areas. Maine is a close second, with only 38.6 percent of its population in urban areas.
Rankings by Urban Land Share of Total Land
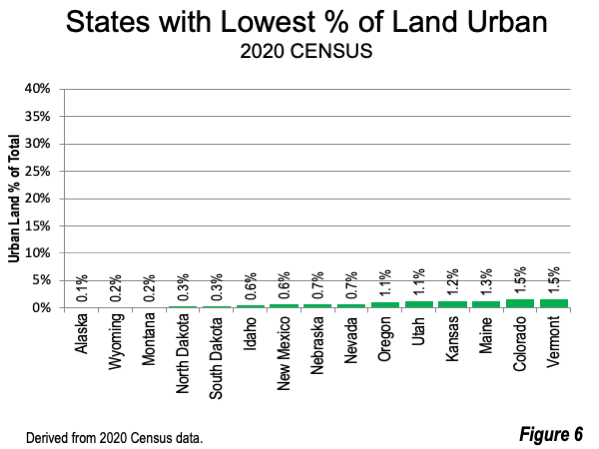
The 15 states with the largest and smallest percentage of total land are illustrated in Figures 5 and 6.
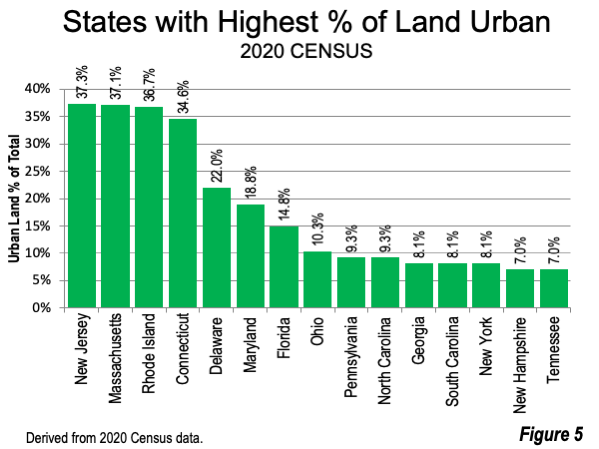
The four states with the largest share of land that is urban are all located in the Northeast. New Jersey has the highest share of its land in urbanization, at 37.3%. Nearly all of New Jersey’s urbanization is in the suburbs of New York and Philadelphia. Massachusetts nearly equals the urbanized land share of New Jersey, at 37.1%. Rhode Island ranks a close third, with 36.7% of its land urbanized. Connecticut ranks fourth, at 34.6% of its land urbanized. Both Rhode Island and Connecticut have portions have extensions of urbanization from Massachusetts urban areas (Boston and Worcester). Each of these five states with the greatest percentage of urban land is among the smallest geographically in the nation.
Delaware, with two of its three counties in suburban Philadelphia has 22.0% of its land urbanized. Maryland, with its extensive suburbs of Washington, DC and the large Baltimore urban area ranks sixth, at 18.8%. Florida has an urban land share of 14.8%.
There are nine states with urbanized land shares less than one percent, including Alaska, Wyoming, Montana, North Dakota, South Dakota, Idaho,New Mexico, Nebraska and Nevada.
One of the reasons that the urban area criteria was changed was so that the Census Bureau could provide complete urban area estimates (population, land area and population density) between censuses, using its master file of addresses. At the same time, the Census Bureau indicated that, while it now has that ability, it has no plans to do so at this time (Note).
The dominance of the West among the states with the highest urban densities may be surprising, given their historically lower urban core densities than in the Northeast and Midwest. But while western cities have experienced some decline in their cores, the losses in the rest of the country have been greater. Today there are only four major metropolitan areas in the West that have large (100,000 or more) and These losses, but much more the suburban expansion of these metros explain much of the ascendance of the West in urban density.
Note 1: As a matter of interest, Canada, which used criteria very similar to that of the US Census Bureau for its own urban areas (called “population centres”) in the 2016 and 2021 censuses. On important difference was that rather than having a minimum population of 2,500, Canada’s population centres are required to have a minimum population of 1,000.
Note 2: Derived from Census Bureau data and unpublished data from the Demographia City Sector Model.
Wendell Cox is principal of Demographia, an international public policy firm located in the St. Louis metropolitan area. He is a founding senior fellow at the Urban Reform Institute, Houston, a Senior Fellow with the Frontier Centre for Public Policy in Winnipeg and a member of the Advisory Board of the Center for Demographics and Policy at Chapman University in Orange, California. He has served as a visiting professor at the Conservatoire National des Arts et Metiers in Paris. His principal interests are economics, poverty alleviation, demographics, urban policy and transport. He is co-author of the annual Demographia International Housing Affordability Survey and author of Demographia World Urban Areas.
Mayor Tom Bradley appointed him to three terms on the Los Angeles County Transportation Commission (1977-1985) and Speaker of the House Newt Gingrich appointed him to the Amtrak Reform Council, to complete the unexpired term of New Jersey Governor Christine Todd Whitman (1999-2002). He is author of War on the Dream: How Anti-Sprawl Policy Threatens the Quality of Life and Toward More Prosperous Cities: A Framing Essay on Urban Areas, Transport, Planning and the Dimensions of Sustainability.
Photo: Las Vegas Urban Area, with 71% of Nevada’s population, it is the 5th densest major urban area in the United States as of 2020 (following San Francisco, Los Angeles, San Jose, New York and Honolulu. Credit: Stan Shebs, downtown Las Vegas, Nevada via Wikimedia under CC 3.0 License.
Table 1 (back to reference)
| Urbanization by State (& DC) 2020 Census | ||||||||||
| State | Total Population | Urban Population | Urban Share | Rank | Total Land Area | Urban Land Area | Share of Total Land | Rank | Urban Density | Rank |
| Alabama | 5,024,279 | 2,900,880 | 57.7% | 43 | 50,645 | 2,093 | 4.1% | 23 | 1,386 | 47 |
| Alaska | 733,391 | 475,967 | 64.9% | 36 | 570,641 | 324 | 0.1% | 50 | 1,467 | 45 |
| Arizona | 7,151,502 | 6,385,230 | 89.3% | 8 | 113,594 | 2,164 | 1.9% | 33 | 2,951 | 10 |
| Arkansas | 3,011,524 | 1,670,677 | 55.5% | 45 | 52,035 | 1,088 | 2.1% | 31 | 1,536 | 43 |
| California | 39,538,223 | 37,259,490 | 94.2% | 1 | 155,779 | 7,779 | 5.0% | 20 | 4,790 | 1 |
| Colorado | 5,773,714 | 4,966,936 | 86.0% | 13 | 103,642 | 1,577 | 1.5% | 37 | 3,150 | 7 |
| Connecticut | 3,605,944 | 3,110,153 | 86.3% | 11 | 4,842 | 1,673 | 34.6% | 4 | 1,859 | 37 |
| Delaware | 989,948 | 817,817 | 82.6% | 17 | 1,949 | 430 | 22.0% | 5 | 1,903 | 36 |
| Dist. of Columbia | 689,545 | 689,545 | 100.0% | 61 | 61 | 100.0% | 11,281 | |||
| Florida | 21,538,187 | 19,714,806 | 91.5% | 4 | 53,625 | 7,952 | 14.8% | 7 | 2,479 | 18 |
| Georgia | 10,711,908 | 7,933,986 | 74.1% | 23 | 57,513 | 4,662 | 8.1% | 11 | 1,702 | 39 |
| Hawaii | 1,455,271 | 1,252,450 | 86.1% | 12 | 6,423 | 302 | 4.7% | 21 | 4,142 | 3 |
| Idaho | 1,839,106 | 1,273,437 | 69.2% | 31 | 82,643 | 478 | 0.6% | 45 | 2,662 | 14 |
| Illinois | 12,812,508 | 11,137,590 | 86.9% | 10 | 55,519 | 3,704 | 6.7% | 18 | 3,007 | 9 |
| Indiana | 6,785,528 | 4,829,686 | 71.2% | 29 | 35,826 | 2,425 | 6.8% | 16 | 1,991 | 32 |
| Iowa | 3,190,369 | 2,014,831 | 63.2% | 38 | 55,857 | 977 | 1.7% | 35 | 2,062 | 30 |
| Kansas | 2,937,880 | 2,124,059 | 72.3% | 26 | 81,759 | 976 | 1.2% | 39 | 2,176 | 24 |
| Kentucky | 4,505,836 | 2,644,856 | 58.7% | 41 | 39,486 | 1,379 | 3.5% | 25 | 1,918 | 35 |
| Louisiana | 4,657,757 | 3,332,237 | 71.5% | 28 | 43,204 | 1,951 | 4.5% | 22 | 1,708 | 38 |
| Maine | 1,362,359 | 526,309 | 38.6% | 49 | 30,843 | 404 | 1.3% | 38 | 1,303 | 49 |
| Maryland | 6,177,224 | 5,288,760 | 85.6% | 14 | 9,707 | 1,828 | 18.8% | 6 | 2,893 | 11 |
| Massachusetts | 7,029,917 | 6,416,895 | 91.3% | 5 | 7,800 | 2,891 | 37.1% | 2 | 2,219 | 22 |
| Michigan | 10,077,331 | 7,404,258 | 73.5% | 24 | 56,539 | 3,514 | 6.2% | 19 | 2,107 | 27 |
| Minnesota | 5,706,494 | 4,101,754 | 71.9% | 27 | 79,627 | 1,647 | 2.1% | 32 | 2,491 | 17 |
| Mississippi | 2,961,279 | 1,370,790 | 46.3% | 47 | 46,923 | 1,017 | 2.2% | 30 | 1,348 | 48 |
| Missouri | 6,154,913 | 4,275,663 | 69.5% | 30 | 68,742 | 2,034 | 3.0% | 28 | 2,102 | 28 |
| Montana | 1,084,225 | 579,177 | 53.4% | 46 | 145,546 | 292 | 0.2% | 48 | 1,982 | 34 |
| Nebraska | 1,961,504 | 1,432,003 | 73.0% | 25 | 76,824 | 542 | 0.7% | 43 | 2,640 | 15 |
| Nevada | 3,104,614 | 2,921,203 | 94.1% | 2 | 109,781 | 786 | 0.7% | 42 | 3,715 | 4 |
| New Hampshire | 1,377,529 | 803,420 | 58.3% | 42 | 8,953 | 631 | 7.0% | 14 | 1,274 | 50 |
| New Jersey | 9,288,994 | 8,708,779 | 93.8% | 3 | 7,354 | 2,740 | 37.3% | 1 | 3,178 | 6 |
| New Mexico | 2,117,522 | 1,578,552 | 74.5% | 22 | 121,298 | 737 | 0.6% | 44 | 2,143 | 25 |
| New York | 20,201,249 | 17,665,166 | 87.4% | 9 | 47,126 | 3,803 | 8.1% | 13 | 4,645 | 2 |
| North Carolina | 10,439,388 | 6,964,727 | 66.7% | 34 | 48,618 | 4,523 | 9.3% | 10 | 1,540 | 42 |
| North Dakota | 779,094 | 474,989 | 61.0% | 40 | 69,001 | 215 | 0.3% | 47 | 2,208 | 23 |
| Ohio | 11,799,448 | 9,001,099 | 76.3% | 20 | 40,861 | 4,206 | 10.3% | 8 | 2,140 | 26 |
| Oklahoma | 3,959,353 | 2,558,611 | 64.6% | 37 | 68,595 | 1,288 | 1.9% | 34 | 1,987 | 33 |
| Oregon | 4,237,256 | 3,410,984 | 80.5% | 18 | 95,988 | 1,063 | 1.1% | 41 | 3,209 | 5 |
| Pennsylvania | 13,002,700 | 9,941,070 | 76.5% | 19 | 44,743 | 4,176 | 9.3% | 9 | 2,380 | 20 |
| Rhode Island | 1,097,379 | 999,191 | 91.1% | 6 | 1,034 | 380 | 36.7% | 3 | 2,631 | 16 |
| South Carolina | 5,118,425 | 3,477,869 | 67.9% | 32 | 30,061 | 2,426 | 8.1% | 12 | 1,433 | 46 |
| South Dakota | 886,667 | 507,347 | 57.2% | 44 | 75,811 | 246 | 0.3% | 46 | 2,066 | 29 |
| Tennessee | 6,910,840 | 4,577,282 | 66.2% | 35 | 41,235 | 2,888 | 7.0% | 15 | 1,585 | 41 |
| Texas | 29,145,505 | 24,400,697 | 83.7% | 15 | 261,232 | 9,052 | 3.5% | 26 | 2,696 | 13 |
| Utah | 3,271,616 | 2,937,303 | 89.8% | 7 | 82,170 | 942 | 1.1% | 40 | 3,119 | 8 |
| Vermont | 643,077 | 225,850 | 35.1% | 50 | 9,217 | 142 | 1.5% | 36 | 1,595 | 40 |
| Virginia | 8,631,393 | 6,528,313 | 75.6% | 21 | 39,490 | 2,642 | 6.7% | 17 | 2,471 | 19 |
| Washington | 7,705,281 | 6,424,035 | 83.4% | 16 | 66,456 | 2,334 | 3.5% | 24 | 2,752 | 12 |
| West Virginia | 1,793,716 | 800,857 | 44.6% | 48 | 24,038 | 540 | 2.2% | 29 | 1,483 | 44 |
| Wisconsin | 5,893,718 | 3,953,691 | 67.1% | 33 | 54,158 | 1,771 | 3.3% | 27 | 2,232 | 21 |
| Wyoming | 576,851 | 357,750 | 62.0% | 39 | 97,093 | 177 | 0.2% | 49 | 2,024 | 31 |
| United States | 331,449,281 | 265,149,027 | 80.0% | 3,531,907 | 103,872 | 2.9% | 2,553 | |||
| Source: US Census Bureau | ||||||||||


