
The rise of remote and hybrid work has brought about a significant shift in how people access employment opportunities, reducing the need for physical commuting. This article examines the latest data for major metropolitan areas in the United States (with over one million residents) from 2019 to 2022, highlighting the transition from previous work modes to working from home (Figure 1 and Table 1). The 2022 work access market shares for major metropolitan areas are in Table 2.
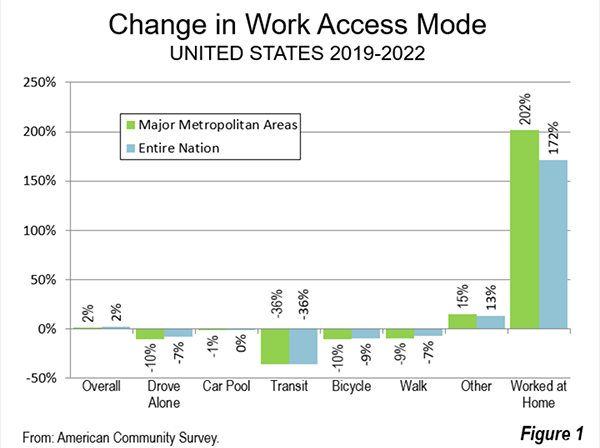
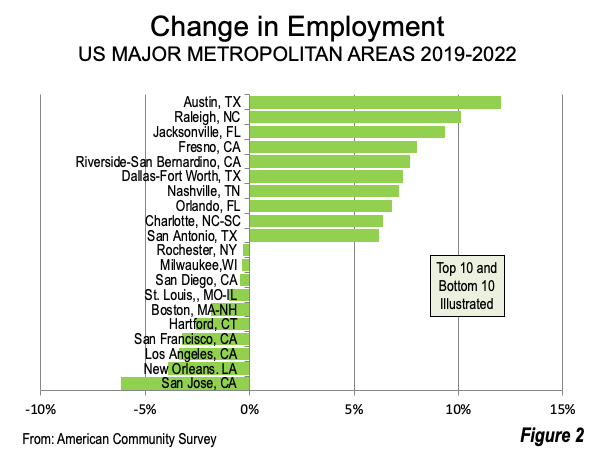
Overall, major metropolitan area employment increased by 1.9% from 2019 to 2022, slightly below the national increase of 2.3% (Figure 2). Among these metros, there was a remarkable 202% increase in the number of people working from home during this period.
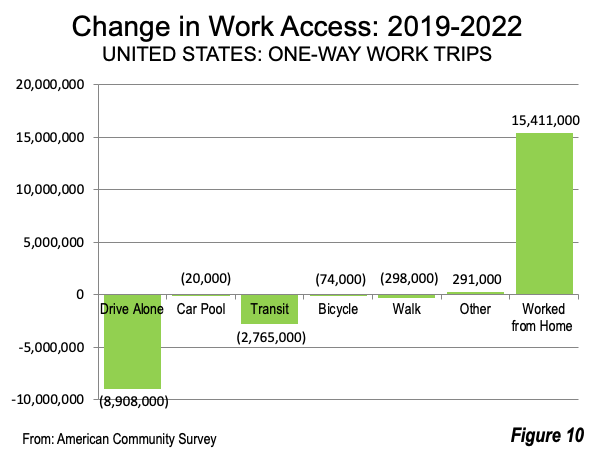
The most significant decline was observed in transit, with a substantial 36% decrease. Bicycling and driving alone also saw losses of 10.3% and 10.0%, respectively, while walking experienced a 9% reduction. Carpooling showed a minor loss at 1.2%. The only category that saw an increase apart from working from home was the "other" category, encompassing motorcycles, taxicabs and others.
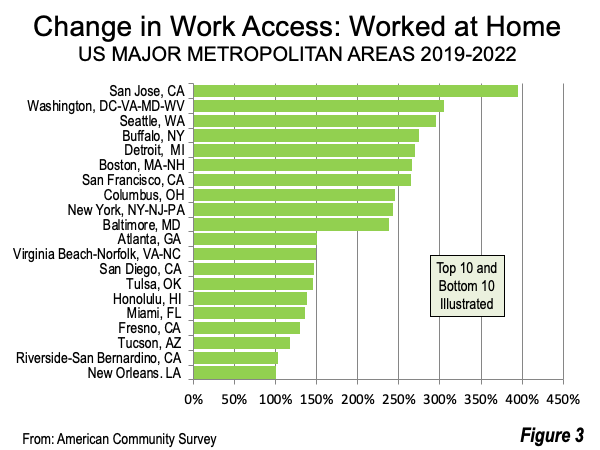
In all major metropolitan areas, the market share of working from home doubled or even more (Figure 3). The most significant gains in remote work were witnessed in San Jose (395%), Washington (305%), Seattle (395%), Buffalo (274%), and Detroit (269%). New Orleans had the smallest gain at 100%. Riverside – San Bernardino (103%), Tucson (118%), Fresno (130%), and Miami (135%) also had comparatively small gains in remote work.
Data for Major Metropolitan Areas
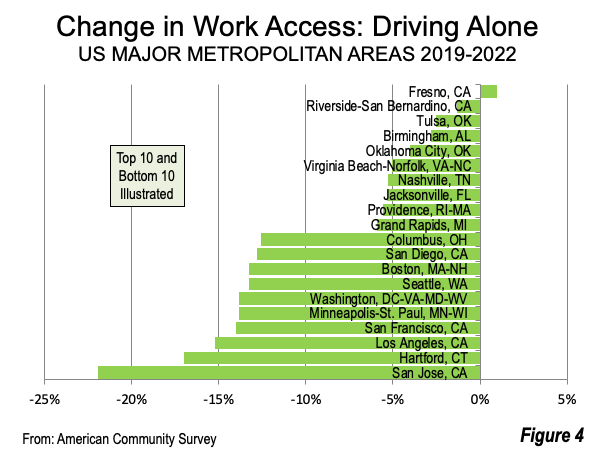
Only one major metropolitan area, Fresno, showed an increase "driving alone" (Figure 4), with a modest gain of 1%. The smallest losses in this category were observed in Riverside-San Bernardino (1%), Birmingham (3%), Tucson (3%), and Oklahoma City (4%). On the other hand, the most significant declines in driving alone were recorded in San Jose (22%), Hartford (17%), Los Angeles (15%), San Francisco (14%), and Minneapolis-St. Paul (14%).
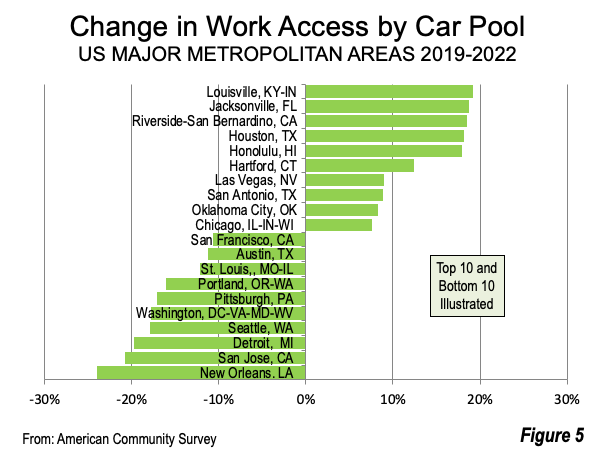
Carpooling outperformed driving alone, with the largest increases (Figure 5) seen in Louisville (19%), Jacksonville (19%), Riverside-San Bernardino (19%), Houston (18%), and Honolulu (18%). The largest market share losses for carpooling occurred in New Orleans (24%), San Jose (21%), Detroit (20%), Seattle (18%), and Washington (18%).
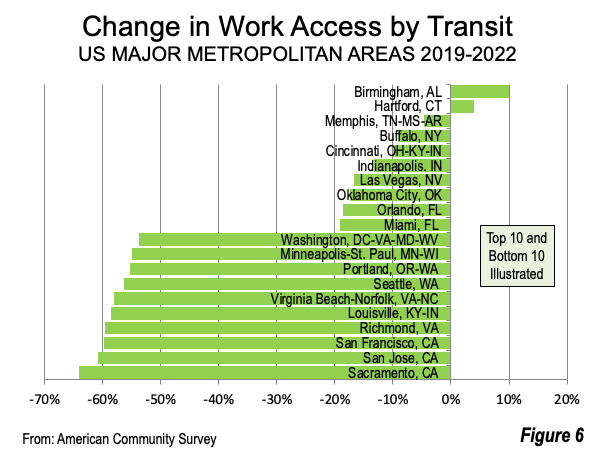
Transit saw the most substantial market share loss, with significant declines (Figure 6). However, two metropolitan areas experienced increases, with Birmingham at 9% and Hartford at 4%. The most significant transit market share losses were in Sacramento (64%), San Jose (61%), San Francisco (60%), Richmond (60%), and Louisville (59%).
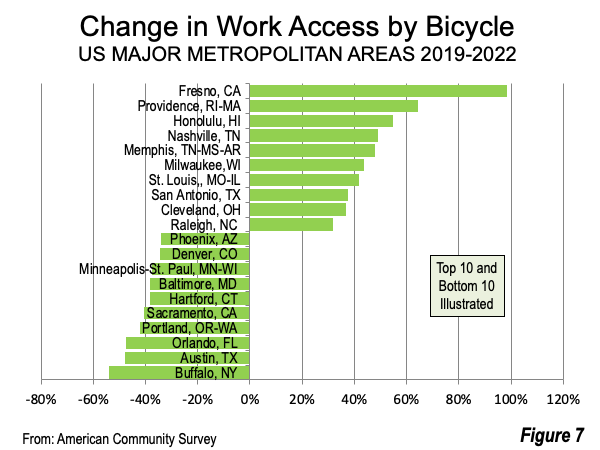
While bicycle commuting had an overall loss, several metropolitan areas saw substantial market share increases (Figure 7), with the most significant one in Fresno (98%). Other areas with notable gains included Providence (64%), Honolulu (55%), Nashville (49%), and Memphis (48%). The largest bicycle commuting losses were in Buffalo (54%), Austin (48%), Orlando (48%), Portland (42%), and Sacramento (41%).
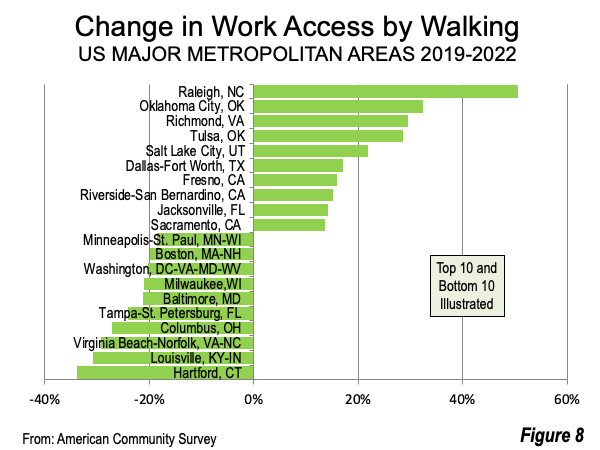
Walking saw significant increases (Figure 8) in Raleigh (51%), Oklahoma City (32%), Richmond (30%), Tulsa (29%), and Salt Lake City (22%). Conversely, the most substantial walking losses were in Hartford (34%), Louisville (31%), Virginia Beach-Norfolk (29%), Columbus (27%), and Tampa-St. Petersburg (24%).
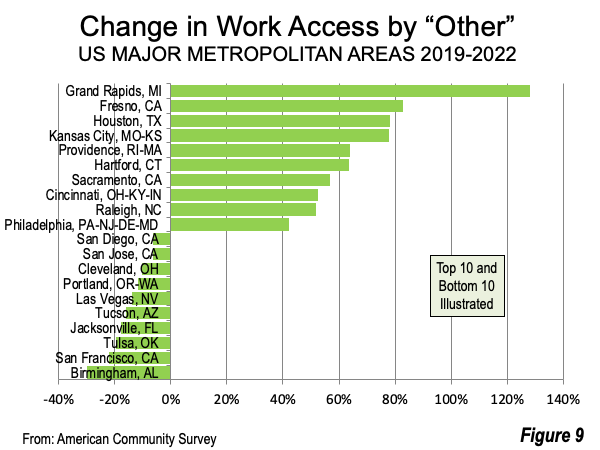
The largest gains (Figure 9) in the "other" category (including motorcycles, taxicabs, and other modes) were in Grand Rapids (128%), Fresno (83%), Houston (78%), Kansas City (78%), and Providence (64%). On the other hand, the most significant losses in this category were in Birmingham (64%), San Francisco (22%), Tulsa (20%), Jacksonville (18%), and Tucson (18%).
Public Policy Implications: Past and Future
The shift towards remote work has significantly altered the dynamic between employees and employers. Over the past six decades, government policies have sought to attract drivers out of their cars and in to transit through subsidies that have reduced fares, expanded services, and built costly rail systems. Transit subsidies exceeded $1.5 trillion (adjusted for inflation) through 2018. Despite these substantial contributions, between 1960 and 2019, transit commuting declined by approximately 30,000 daily one-way trips. At the same time commuting by car saw an increase of 90 million daily one-way commuters. From a mathematical perspective, the significant subsidies to transit did not succeed in attracting a single driver.
In stark contrast, nearly 9 million commuters switched from cars to working from home between 2019 and 2022. This remarkable shift occurred with virtually no subsidies (Figure 10), signifying the appeal and viability of remote work arrangements.
A recent New York Times, commentary titled "The Five Day Office Week is Dead" by Professor Nicholas Bloom of Stanford University expresses optimism about the future expansion of working from home. Bloom and his colleagues have observed a growing trend in patent applications that support remote work and noted the increased acceptance of remote work in startup companies. These emerging trends seem likely to auger well for the decades to come.
Wendell Cox is principal of Demographia, an international public policy firm located in the St. Louis metropolitan area. He is a founding senior fellow at the Urban Reform Institute, Houston, a Senior Fellow with the Frontier Centre for Public Policy in Winnipeg and a member of the Advisory Board of the Center for Demographics and Policy at Chapman University in Orange, California. He has served as a visiting professor at the Conservatoire National des Arts et Metiers in Paris. His principal interests are economics, poverty alleviation, demographics, urban policy and transport. He is co-author of the annual Demographia International Housing Affordability Survey and author of Demographia World Urban Areas.
Mayor Tom Bradley appointed him to three terms on the Los Angeles County Transportation Commission (1977-1985) and Speaker of the House Newt Gingrich appointed him to the Amtrak Reform Council, to complete the unexpired term of New Jersey Governor Christine Todd Whitman (1999-2002). He is author of War on the Dream: How Anti-Sprawl Policy Threatens the Quality of Life and Toward More Prosperous Cities: A Framing Essay on Urban Areas, Transport, Planning and the Dimensions of Sustainability.
Photo: Working from home via Flickr under CC 2.0 License.
| Table 1: Change in Work Access Mode: 2019 to 2022, Major Metropolitan Areas | ||||||||
| Metropolitan Areas | Total | Drove Alone | Car Pool |
Transit | Bicycle | Walk | Other | Worked from Home |
| Atlanta, GA | 5.4% | -8.5% | 1.3% | -49.1% | -27.2% | -2.8% | 3.0% | 150.7% |
| Austin, TX | 12.0% | -9.0% | -11.2% | -34.7% | -47.9% | 1.0% | 40.3% | 197.2% |
| Baltimore, MD | 3.4% | -9.5% | -2.6% | -38.6% | -38.4% | -21.2% | 15.2% | 237.8% |
| Birmingham, AL | 5.7% | -2.8% | 5.0% | 9.9% | -21.5% | -17.0% | -29.9% | 208.2% |
| Boston, MA-NH | -1.8% | -13.3% | -10.5% | -41.2% | -12.7% | -19.9% | 26.7% | 266.1% |
| Buffalo, NY | 1.9% | -10.0% | 7.6% | -9.1% | -54.1% | 7.6% | 28.4% | 273.9% |
| Charlotte, NC-SC | 6.4% | -10.6% | 6.1% | -50.1% | 17.8% | -10.1% | -3.4% | 193.5% |
| Chicago, IL-IN-WI | 0.3% | -8.9% | 7.6% | -43.3% | 1.5% | -13.6% | 4.6% | 204.6% |
| Cincinnati, OH-KY-IN | 2.1% | -9.3% | -5.7% | -10.0% | -14.2% | -8.4% | 52.6% | 186.6% |
| Cleveland, OH | 0.1% | -10.4% | -9.4% | -40.3% | 36.8% | 1.1% | -10.5% | 228.1% |
| Columbus, OH | 1.7% | -12.6% | -2.6% | -23.8% | -12.5% | -27.2% | 31.5% | 245.4% |
| Dallas-Fort Worth, TX | 7.4% | -7.3% | 3.7% | -49.3% | 16.3% | 17.1% | 40.8% | 198.2% |
| Denver, CO | 4.0% | -11.4% | -4.3% | -49.5% | -34.4% | -17.5% | 25.9% | 169.1% |
| Detroit, MI | 0.2% | -11.6% | -19.8% | -42.2% | 22.7% | 5.2% | 13.0% | 269.1% |
| Fresno, CA | 8.0% | 1.0% | -5.1% | -42.4% | 98.3% | 16.0% | 82.8% | 129.7% |
| Grand Rapids, MI | 3.5% | -5.9% | 6.1% | -34.6% | 7.1% | 1.5% | 128.0% | 162.3% |
| Hartford, CT | -2.6% | -17.0% | 12.4% | 4.0% | -38.4% | -33.8% | 63.5% | 222.8% |
| Honolulu, HI | 0.3% | -7.2% | 17.9% | -35.1% | 54.7% | -4.5% | -1.9% | 138.3% |
| Houston, TX | 4.0% | -8.1% | 18.1% | -24.7% | -6.7% | -11.4% | 78.0% | 164.6% |
| Indianapolis. IN | 5.3% | -6.1% | 1.2% | -13.3% | 21.4% | -13.9% | 39.9% | 181.5% |
| Jacksonville, FL | 9.4% | -5.4% | 18.7% | -50.3% | 27.6% | 14.2% | -17.9% | 173.6% |
| Kansas City, MO-KS | 2.2% | -10.6% | -8.2% | -36.1% | -30.9% | -4.6% | 77.9% | 183.6% |
| Las Vegas, NV | 2.1% | -8.3% | 8.9% | -16.7% | 24.4% | 6.6% | -13.7% | 182.0% |
| Los Angeles, CA | -3.4% | -15.2% | 0.9% | -36.1% | -15.3% | -10.4% | -2.3% | 165.9% |
| Louisville, KY-IN | 2.9% | -7.0% | 19.2% | -58.5% | -23.6% | -30.8% | 12.0% | 180.3% |
| Memphis, TN-MS-AR | -0.2% | -9.3% | 3.2% | -4.7% | 48.0% | 12.7% | -4.3% | 205.2% |
| Miami, FL | -0.3% | -11.1% | 4.2% | -19.2% | 7.9% | -5.3% | 2.9% | 135.2% |
| Milwaukee,WI | -0.4% | -10.0% | -3.2% | -41.6% | 43.5% | -21.0% | 24.4% | 212.7% |
| Minneapolis-St. Paul, MN-WI | 0.0% | -13.9% | -10.2% | -55.1% | -37.4% | -18.6% | 30.7% | 224.1% |
| Nashville, TN | 7.2% | -5.3% | -7.0% | -26.9% | 49.0% | -18.3% | 21.5% | 164.4% |
| New Orleans. LA | -3.9% | -7.8% | -24.1% | -28.8% | -28.0% | 3.7% | 3.7% | 99.9% |
| New York, NY-NJ-PA | 0.5% | -8.4% | 7.0% | -24.1% | 21.1% | -6.0% | 34.8% | 242.2% |
| Oklahoma City, OK | 4.5% | -4.0% | 8.3% | -17.4% | -5.6% | 32.4% | 8.8% | 154.1% |
| Orlando, FL | 6.8% | -6.8% | -2.1% | -18.6% | -47.6% | 4.5% | 8.0% | 191.5% |
| Philadelphia, PA-NJ-DE-MD | 3.9% | -7.9% | -9.4% | -38.6% | 15.9% | -9.3% | 42.2% | 227.8% |
| Phoenix, AZ | 4.4% | -11.7% | -5.4% | -51.8% | -33.9% | -9.0% | 14.9% | 187.1% |
| Pittsburgh, PA | 0.7% | -8.1% | -17.1% | -50.0% | -12.3% | -11.6% | 11.4% | 202.5% |
| Portland, OR-WA | 2.5% | -10.0% | -16.1% | -55.3% | -42.0% | -4.1% | -11.7% | 197.6% |
| Providence, RI-MA | 5.6% | -5.6% | 4.2% | -43.0% | 64.3% | -14.5% | 64.0% | 227.3% |
| Raleigh, NC | 10.1% | -11.3% | 2.1% | -32.2% | 31.8% | 50.5% | 51.9% | 178.6% |
| Richmond, VA | 2.9% | -11.2% | -9.3% | -59.7% | -22.4% | 29.5% | 4.5% | 232.3% |
| Riverside-San Bernardino, CA | 7.7% | -1.3% | 18.6% | -27.3% | 14.4% | 15.3% | -3.1% | 102.7% |
| Rochester, NY | -0.3% | -9.5% | -10.0% | -40.5% | -28.2% | -13.6% | 25.7% | 204.4% |
| Sacramento, CA | 3.3% | -11.1% | 3.0% | -64.1% | -40.6% | 13.7% | 56.7% | 161.0% |
| Salt Lake City, UT | 3.5% | -9.8% | 5.8% | -52.3% | -1.7% | 22.0% | 11.2% | 206.3% |
| San Antonio, TX | 6.2% | -7.2% | 8.9% | -22.1% | 37.5% | -3.5% | 16.9% | 227.2% |
| San Diego, CA | -0.5% | -12.8% | -4.9% | -31.7% | -25.4% | 1.4% | -6.4% | 146.5% |
| San Francisco, CA | -3.2% | -14.0% | -10.6% | -59.8% | -15.8% | -18.3% | -22.3% | 264.3% |
| San Jose, CA | -6.1% | -22.0% | -20.8% | -60.8% | -19.9% | -17.5% | -6.5% | 395.2% |
| Seattle, WA | 0.9% | -13.3% | -18.0% | -56.4% | -32.1% | -15.7% | -0.3% | 295.1% |
| St. Louis,, MO-IL | -1.0% | -12.4% | -12.1% | -28.9% | 41.6% | -0.8% | -5.3% | 213.1% |
| Tampa-St. Petersburg, FL | 5.6% | -10.1% | 2.8% | -32.5% | 19.9% | -24.0% | -1.5% | 160.2% |
| Tucson, AZ | 1.6% | -7.6% | 7.5% | -33.8% | -30.1% | -4.9% | -16.0% | 117.7% |
| Tulsa, OK | 4.1% | -2.5% | -0.3% | -41.9% | -1.4% | 28.6% | -19.5% | 145.9% |
| Virginia Beach-Norfolk, VA-NC | 1.4% | -5.0% | 6.1% | -58.1% | -0.6% | -29.2% | 9.9% | 149.0% |
| Washington, DC-VA-MD-WV | 0.2% | -13.8% | -17.9% | -53.8% | -19.5% | -20.3% | 11.9% | 304.9% |
| Major Metropolitan Areas | 1.9% | -10.0% | -1.2% | -36.1% | -10.3% | -9.1% | 14.9% | 201.7% |
| Balance of United States | 2.9% | -4.0% | 1.4% | -29.8% | -7.2% | -4.2% | 10.6% | 119.6% |
| United States | 2.3% | -7.5% | -0.1% | -35.6% | -9.2% | -7.2% | 13.4% | 171.8% |
| Derived from American Community Survey | ||||||||
| Table 2: Work Access Mode: 2022: Major Metropolitan Areas | ||||||||
| Metropolitan Areas | Total | Drove Alone | Car Pool |
Transit | Bicycle | Walk | Other | Worked from Home |
| Atlanta, GA | 100.0% | 66.5% | 8.4% | 1.3% | 0.1% | 1.1% | 1.7% | 20.8% |
| Austin, TX | 100.0% | 60.7% | 7.4% | 1.1% | 0.3% | 1.8% | 1.5% | 27.3% |
| Baltimore, MD | 100.0% | 67.7% | 7.8% | 2.7% | 0.2% | 1.9% | 1.6% | 18.1% |
| Birmingham, AL | 100.0% | 77.4% | 8.6% | 0.4% | 0.1% | 1.0% | 0.9% | 11.5% |
| Boston, MA-NH | 100.0% | 59.0% | 6.5% | 7.9% | 0.9% | 4.3% | 1.9% | 19.6% |
| Buffalo, NY | 100.0% | 72.4% | 8.1% | 2.6% | 0.2% | 2.6% | 1.5% | 12.7% |
| Charlotte, NC-SC | 100.0% | 66.6% | 8.5% | 0.7% | 0.1% | 1.2% | 1.2% | 21.7% |
| Chicago, IL-IN-WI | 100.0% | 63.1% | 8.0% | 7.0% | 0.6% | 2.6% | 1.6% | 17.3% |
| Cincinnati, OH-KY-IN | 100.0% | 72.4% | 8.0% | 1.3% | 0.1% | 1.8% | 1.3% | 15.2% |
| Cleveland, OH | 100.0% | 72.7% | 7.0% | 1.7% | 0.3% | 2.2% | 1.1% | 15.0% |
| Columbus, OH | 100.0% | 70.3% | 7.6% | 1.2% | 0.2% | 1.6% | 1.2% | 17.9% |
| Dallas-Fort Worth, TX | 100.0% | 69.5% | 9.1% | 0.6% | 0.2% | 1.2% | 1.4% | 18.0% |
| Denver, CO | 100.0% | 63.1% | 7.3% | 2.3% | 0.6% | 1.9% | 1.1% | 23.8% |
| Detroit, MI | 100.0% | 72.7% | 7.3% | 0.8% | 0.3% | 1.4% | 1.3% | 16.3% |
| Fresno, CA | 100.0% | 72.6% | 11.5% | 0.6% | 0.5% | 1.5% | 2.1% | 11.3% |
| Grand Rapids, MI | 100.0% | 75.3% | 8.5% | 0.8% | 0.4% | 2.0% | 1.4% | 11.6% |
| Hartford, CT | 100.0% | 70.4% | 7.4% | 2.4% | 0.2% | 1.9% | 1.2% | 16.6% |
| Honolulu, HI | 100.0% | 62.2% | 15.0% | 4.6% | 1.0% | 5.3% | 2.7% | 9.2% |
| Houston, TX | 100.0% | 71.5% | 10.5% | 1.4% | 0.2% | 1.1% | 2.3% | 13.0% |
| Indianapolis. IN | 100.0% | 72.7% | 9.3% | 0.6% | 0.3% | 1.2% | 1.1% | 14.8% |
| Jacksonville, FL | 100.0% | 69.6% | 8.2% | 0.5% | 0.3% | 1.1% | 1.5% | 18.7% |
| Kansas City, MO-KS | 100.0% | 73.2% | 6.5% | 0.5% | 0.1% | 1.0% | 1.2% | 17.4% |
| Las Vegas, NV | 100.0% | 70.2% | 10.5% | 2.3% | 0.3% | 1.2% | 2.6% | 12.9% |
| Los Angeles, CA | 100.0% | 65.8% | 9.8% | 3.1% | 0.6% | 2.2% | 1.8% | 16.7% |
| Louisville, KY-IN | 100.0% | 73.9% | 9.0% | 0.8% | 0.2% | 1.3% | 1.7% | 13.2% |
| Memphis, TN-MS-AR | 100.0% | 76.4% | 9.6% | 0.3% | 0.1% | 1.3% | 1.5% | 10.7% |
| Miami, FL | 100.0% | 69.0% | 9.3% | 2.3% | 0.5% | 1.6% | 2.3% | 14.8% |
| Milwaukee,WI | 100.0% | 73.5% | 7.5% | 1.7% | 0.4% | 2.1% | 0.9% | 14.0% |
| Minneapolis-St. Paul, MN-WI | 100.0% | 66.6% | 7.1% | 2.0% | 0.5% | 1.9% | 1.3% | 20.7% |
| Nashville, TN | 100.0% | 70.2% | 8.0% | 0.7% | 0.2% | 1.1% | 1.5% | 18.3% |
| New Orleans. LA | 100.0% | 74.2% | 8.0% | 1.6% | 0.7% | 3.0% | 1.8% | 10.9% |
| New York, NY-NJ-PA | 100.0% | 44.9% | 6.5% | 24.0% | 0.8% | 5.4% | 2.5% | 16.0% |
| Oklahoma City, OK | 100.0% | 77.1% | 8.8% | 0.4% | 0.2% | 1.6% | 1.2% | 10.6% |
| Orlando, FL | 100.0% | 68.6% | 9.4% | 1.0% | 0.2% | 1.3% | 1.4% | 18.1% |
| Philadelphia, PA-NJ-DE-MD | 100.0% | 63.2% | 7.0% | 5.5% | 0.7% | 3.1% | 1.6% | 18.8% |
| Phoenix, AZ | 100.0% | 63.9% | 9.7% | 0.8% | 0.4% | 1.3% | 2.0% | 21.8% |
| Pittsburgh, PA | 100.0% | 68.6% | 7.0% | 3.0% | 0.2% | 3.1% | 1.1% | 17.1% |
| Portland, OR-WA | 100.0% | 61.5% | 7.2% | 2.9% | 1.1% | 3.3% | 1.2% | 23.0% |
| Providence, RI-MA | 100.0% | 72.6% | 8.2% | 0.9% | 0.4% | 2.5% | 1.5% | 13.9% |
| Raleigh, NC | 100.0% | 64.1% | 6.9% | 0.4% | 0.2% | 1.4% | 1.2% | 25.7% |
| Richmond, VA | 100.0% | 69.4% | 7.6% | 0.6% | 0.2% | 2.2% | 1.5% | 18.4% |
| Riverside-San Bernardino, CA | 100.0% | 72.8% | 11.0% | 0.5% | 0.3% | 1.5% | 1.4% | 12.6% |
| Rochester, NY | 100.0% | 73.8% | 7.2% | 1.1% | 0.3% | 2.7% | 1.1% | 13.8% |
| Sacramento, CA | 100.0% | 65.8% | 9.2% | 0.8% | 0.8% | 1.8% | 1.7% | 19.9% |
| Salt Lake City, UT | 100.0% | 67.6% | 10.3% | 1.7% | 0.4% | 1.6% | 1.0% | 17.3% |
| San Antonio, TX | 100.0% | 68.6% | 11.4% | 1.4% | 0.2% | 1.8% | 1.6% | 15.0% |
| San Diego, CA | 100.0% | 66.2% | 8.6% | 2.0% | 0.5% | 3.0% | 1.6% | 18.2% |
| San Francisco, CA | 100.0% | 50.9% | 8.6% | 7.5% | 1.4% | 3.8% | 1.8% | 25.9% |
| San Jose, CA | 100.0% | 61.3% | 9.1% | 2.4% | 1.5% | 1.9% | 1.7% | 22.2% |
| Seattle, WA | 100.0% | 57.5% | 8.0% | 4.7% | 0.7% | 3.2% | 1.1% | 24.8% |
| St. Louis,, MO-IL | 100.0% | 73.6% | 6.4% | 1.3% | 0.3% | 1.6% | 1.0% | 15.8% |
| Tampa-St. Petersburg, FL | 100.0% | 66.2% | 8.3% | 0.7% | 0.6% | 1.2% | 1.7% | 21.3% |
| Tucson, AZ | 100.0% | 70.0% | 9.8% | 1.1% | 0.9% | 2.3% | 1.2% | 14.7% |
| Tulsa, OK | 100.0% | 77.6% | 9.2% | 0.3% | 0.2% | 1.3% | 1.0% | 10.3% |
| Virginia Beach-Norfolk, VA-NC | 100.0% | 76.2% | 8.1% | 0.7% | 0.3% | 2.1% | 1.5% | 11.1% |
| Washington, DC-VA-MD-WV | 100.0% | 56.7% | 7.4% | 6.1% | 0.6% | 2.6% | 1.9% | 24.7% |
| Major Metropolitan Areas | 100.0% | 64.5% | 8.3% | 4.8% | 0.5% | 2.4% | 1.7% | 17.9% |
| Balance of United States | 100.0% | 74.9% | 9.2% | 0.7% | 0.4% | 2.4% | 1.3% | 11.1% |
| United States | 100.0% | 68.7% | 8.6% | 3.1% | 0.5% | 2.4% | 1.5% | 15.2% |
| Derived from American Community Survey | ||||||||


Maybe just noise...
...but some smaller cities--e.g. New Orleans and Hartford--show up as particular outliers. Anything special going on there in 2019-2022?