Would you like to avoid recessions altogether?
You can come close if you live in the right place.
This report looks at the period January 1991 through April 2009 – a period of 220 months that includes three recessions. Since employment rises and falls monthly because of seasonal trends (school year, holiday retail and more), this report uses 12-month employment growth rates as the measurement criteria – the employment in a given month compared to the employment 12 months earlier. This eliminates seasonality and allows us to compare, if you will, apples with apples.
The metric in this analysis is the percent of months where the 12-month employment growth rate is positive.
 Using employment growth rates as the measurement criteria:
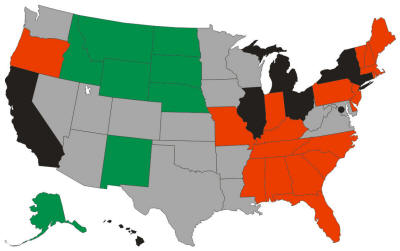
Alaska is 99.1% recession-proof since employment was growing for 218 months out of 220.
Michigan is 51.8% recession-proof since employment was growing for 114 months out of 220.
- All the states are shown in the graphic, color-coded as follows:
- Green is 90% or more
- Grey is 80% to 90%
- Red is 70% to 80%
- Black is less than 70%
Some metropolitan areas are also relatively recession-proof:
| Area |
Share of months where 12-month job growth rate is positive
|
| Grand Junction, CO |
100.00%
|
| McAllen-Edinburg-Mission, TX |
99.50%
|
| Olympia, WA |
99.10%
|
| Bismarck, ND |
98.60%
|
| Anchorage, AK |
97.70%
|
| Fargo, ND-MN |
97.70%
|
| Tyler, TX |
97.30%
|
| Greeley, CO |
96.80%
|
| Iowa City, IA |
96.40%
|
| Sioux Falls, SD |
96.40%
|
| Cheyenne, WY |
95.90%
|
| Columbia, MO |
95.90%
|
| Coeur d'Alene, ID |
95.50%
|
| College Station-Bryan, TX |
95.50%
|
| Billings, MT |
95.00%
|
| Fayetteville-Springdale-Rogers, AR-MO |
94.50%
|
| Laredo, TX |
94.50%
|
| Las Cruces, NM |
94.50%
|
| Valdosta, GA |
94.50%
|
| Killeen-Temple-Fort Hood, TX |
94.10%
|
| Rapid City, SD |
94.10%
|
| Bellingham, WA |
93.60%
|
| Ogden-Clearfield, UT |
93.60%
|
| Knoxville, TN |
93.20%
|
| St. George, UT |
93.20%
|
And, unfortunately, some metropolitan areas are not very recession proof:
| Area |
Share of months where 12-month job growth rate is positive
|
| Baltimore City, MD |
17.70%
|
| Flint, MI |
28.60%
|
| Detroit-Livonia-Dearborn, MI Metro |
34.10%
|
| Philadelphia City, PA |
35.50%
|
| Dayton, OH |
37.30%
|
| Mansfield, OH |
38.20%
|
| Youngstown-Warren-Boardman, OH-PA |
41.80%
|
| Muncie, IN |
42.70%
|
| Kingston, NY |
43.60%
|
| Waterbury, CT NECTA |
45.50%
|
| Binghamton, NY |
47.30%
|
| Lima, OH |
47.30%
|
| Springfield, OH |
48.20%
|
| Detroit-Warren-Livonia, MI |
49.10%
|
| Lansing-East Lansing, MI |
50.00%
|
| Saginaw-Saginaw Township North, MI |
50.50%
|
| Ann Arbor, MI |
51.40%
|
| Cleveland-Elyria-Mentor, OH |
52.70%
|
| Decatur, IL |
52.70%
|
| Terre Haute, IN |
53.60%
|
| Canton-Massillon, OH |
54.10%
|
| Battle Creek, MI |
54.50%
|
| Jackson, MI |
55.00%
|
| Niles-Benton Harbor, MI |
55.00%
|
You can’t necessarily judge a metropolitan area by its State’s employment growth rates. For example, Georgia is only 73.6% recession-proof yet Valdosta is 94.5%. Indiana is 74.5% yet Indianapolis is 90.0%. Missouri is 72.3% yet Columbia is 95.9%.
A complete list of states and metropolitan areas is available at http://jobbait.com/a/rpa.htm.
The data in this report present only part of a recession-proof picture of states and metropolitan areas. Think of them as a long-term picture from 1990 through April 2009. They do not necessarily represent what’s happening today. For example, Olympia WA which is the second-most recession-proof metropolitan area long term has declines in the last two months, March and April 2009. And, this will change next month and the month after.
This report was written by Mark Hovind, President of JobBait. Mark helps six and seven figure executives find jobs by going directly to the decision-makers most likely to hire them. Mark can be reached through www.JobBait.com or by email at [email protected].


Syncseo
His mother remarried and his stepfather, Wallace "Wally" Fitzgerald, adopted him and changed his surname to Fitzgerald. https://www.rebelmouse.com/thegirlfriendactivationsystem