
American metropolitan areas have been the subject of considerable derision. Often characterized as inferior to those of Australia, Canada, Europe and even of Japan by planners and politicians who travel abroad, there has long been a desire to reshape American cities along the lines of foreign models. Yet, despite this, American metropolitan areas generally provide a standard of living to their residents unmatched anywhere in the world. This is based upon the latest comparative economic data for the world’s most affluent metropolitan areas.
International Rankings: American metropolitan areas never seem to place near the top of “quality of living” or “livability” indexes, such as those published by The Economist and the Mercer consulting group. On the other hand European, Australian and Canadian metropolitan areas usually grab the honors, frequently led by the likes of Vancouver, Melbourne, Zurich or Vienna.
The media routinely reports these rankings without serious analytical analysis, which can lead to misunderstanding or even misrepresentation in comparing metropolitan areas on issues of living standards (Note 1). As Owen McShane pointed out on this site before, these ratings serve their purpose, which is to rank metropolitan areas based upon their “attractiveness to expatriate executives”. Not only do these lists fail to consider housing affordability, as McShane indicates, they also do not consider the overall economic performance of metropolitan areas in regard to their residents, which is not an insignificant matter. These highly publicized international listings might be thought of as “money is no object” ratings.
When Money is an Object: The problem here: money is an object for the great majority of people living in the world’s metropolitan areas. This is true in Kinshasa, Seattle, Vancouver or Vienna.
When the available measures of affluence or the standard of living are considered, the picture for US cities drastically improves. Here the US metropolitan areas dominate the list. The best available data is gross domestic product (GDP) per capita, adjusted for national level purchasing power (Note 2). Metropolitan area GDP data is now produced by the Bureau of the Census in the United States and regional data generally conforming to most metropolitan areas is available for the European Union by Eurostat (Note 3). Data for other metropolitan areas can be estimated from other national and regional sources.
In 2005 (the latest available data), The Economist top ten averaged 57th in GDP per capita in the world. Mercer’s top ten did even worse, averaging 62nd. None of The Economist or Mercer top 10 ranked was among the 25 metropolitan areas with the highest GDP per capita. Vienna ranked best, at 27th. Perennial favorites Vancouver and Melbourne ranked 71st and 72nd (Table 1). Zurich, another rating champion, ranks 74th, just ahead of Oklahoma City. In contrast, only 5 of the 51 large metropolitan areas in the United States ranked behind Vancouver, Melbourne and Zurich.
| Table 1 | |||
| Top 10 Economist & Mercer "Cities" | |||
| Ranked by Affluence | |||
| (GDP per Capita, Purchasing Power Parity) | |||
| Metropolitan Areas over 1,000,000 Population | |||
| City or Metropolitan Area | GDP per Capita: Rank among Top 100 World Metropolitan Areas | The Economist | Mercer |
| Vienna | 27 | 2 | 1 |
| Perth | 28 | 5 | |
| Munich | 40 | 7 | |
| Calgary | 46 | 6 | |
| Frankfurt | 51 | 8 | |
| Sydney | 62 | 9 | 10 |
| Toronto | 67 | 4 | |
| Vancouver | 71 | 1 | 4 |
| Melbourne | 72 | 3 | |
| Zurich | 74 | 10 | 2 |
| Helsinki | 84 | 7 | |
| Auckland | 84 | 5 | |
| Dusseldorf | 99 | 6 | |
100 Most Affluent World Metropolitan Areas: GDP per capita estimates for 2005 are provided for the 100 most affluent metropolitan areas in the world with more than 1,000,000 residents (Table 2).
Dominance of the United States: It is perhaps not surprising that San Jose, California ranks as the richest major metropolitan area in the world, with a 2005 GDP per capita of $78,700. Number 2, however, is a surprise: Charlotte, NC-SC, which not only pirated away San Francisco’s largest bank some years ago and has now displaced the tony city by the Bay in the runner-up position. San Francisco and Washington, DC rank third and fourth most affluent in the world. Brussels, grown fat on the largesse of its European Union taxpayers, ranks 5th.
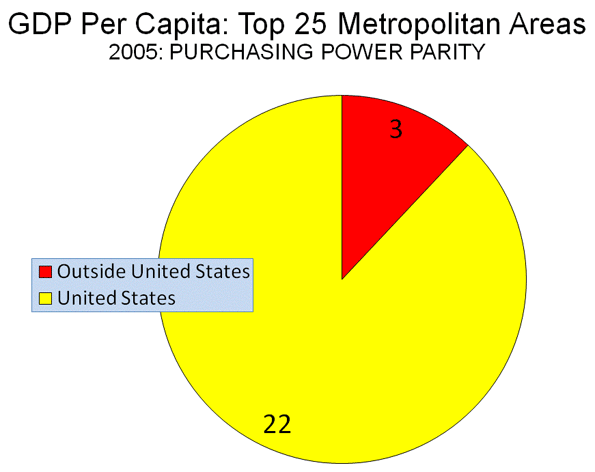
The dominance of the United States is illustrated below.
- The US has 8 of the 10 richest metropolitan areas in the world. Only Stockholm, at number 9, joins Brussels in the top 10 from outside the United States.
- The US has 22 of the top 25 metropolitan areas (Figure)
- 37 of the most affluent 50 metropolitan areas are in the United States. By contrast, Mercer ranks only seven US “cities” in the top 50.
- 46 of the 70 richest metropolitan areas are in the United States
Only one of the 51 US metropolitan areas with more than 1,000,000 fails to make the top 100 in the world, Riverside-San Bernardino ($25,800), which could just as easily be considered a part of the Los Angeles metropolitan area, just as San Jose could be considered a part of the San Francisco metropolitan area.
Outside the United States: Outside the United States, the metropolitan areas of Australia and Canada perform best relative to their size. All five of Australia’s largest metropolitan areas placed in the top 100, with one in the top 50. Five of Canada’s six top metropolitan areas made the top 100, with one in the top 50. Europe placed 33 of its metropolitan areas in the top 100, with 11 in the top 50 and 22 in the second 50.
The top 100 list provides some surprises.
- One eastern European metropolitan area has already entered the top 100. Prague ranks 48th, with a GDP per capita of $42,400, which is more than Frankfurt or Phoenix.
- London, arguably the world’s financial capital, ranks 44th, at $42,700. Some listings show London much higher, however such rankings exclude the outer portion of the metropolitan area, which these estimates include.
- Tokyo-Yokohama ranks 79th, at $35,700. This ranking is lower than others, which either ignore purchasing power or exclude most of the metropolitan area by focusing only on the high income core (the prefecture of Tokyo).
- The world’s two large “city-states,” Singapore and Hong Kong also make the list. Singapore ties Louisville and Sacramento at 53rd, with a GDP per capita of $41,500. Hong Kong ranks 79th, at $35,700. Moreover, it would not be surprising if other Chinese metropolitan areas begin to break into the top 100 over the next decade.
Ranking Metropolitan Areas for People: American metropolitan areas provide their residents a superior standard of living. True enough, the mountains and water features of Vancouver or Zurich are superior to those of Oklahoma City or Charlotte. However, the average resident does not have enough money to spend much time boating in Vancouver or Zurich or taking in what may be a better cultural life. The standard of living may well be better for those with money in Vancouver, Vienna, Melbourne or Zurich than it is in an American metropolitan area. However, most people cannot afford to live like financiers and other “jet-setters.” For everyday people, the American metropolitan area remains the best place in the world to live.
| Table 2 | |||
| Top 100 World Metropolitan Regions | |||
| Gross Domestic Product per Capita: 2005 Estimates | |||
| Purchasing Power Parity | |||
| Metropolitan Areas over 1,000,000 Population | |||
| Rank | Nation | Metropolitan Area | GDP per Capita |
| 1 | United States | San Jose | $78,700 |
| 2 | United States | Charlotte | $67,900 |
| 3 | United States | San Francisco | $65,400 |
| 4 | United States | Washington | $65,300 |
| 5 | Belgium | Brussels | $63,700 |
| 6 | United States | Boston | $59,000 |
| 7 | United States | Seattle | $57,600 |
| 8 | United States | New York | $56,200 |
| 9 | Sweden | Stockholm | $55,100 |
| 10 | United States | Hartford | $55,000 |
| 11 | United States | Denver | $54,700 |
| 12 | United States | Minneapolis-St. Paul | $54,600 |
| 13 | Germany | Hamburg | $53,500 |
| 14 | United States | Dallas-Fort Worth | $53,000 |
| 15 | United States | Houston | $51,900 |
| 16 | United States | Indianapolis | $51,800 |
| 17 | United States | Philadelphia | $50,100 |
| 18 | United States | San Diego | $50,000 |
| 19 | United States | Atlanta | $49,600 |
| 20 | United States | Los Angeles | $49,100 |
| 21 | United States | Chicago | $48,400 |
| 22 | United States | Salt Lake City | $48,200 |
| 23 | United States | Milwaukee | $47,800 |
| 24 | United States | Nashville | $47,700 |
| 24 | United States | Columbus (Ohio) | $47,700 |
| 26 | United States | Las Vegas | $47,400 |
| 27 | Austria | Vienna | $47,000 |
| 28 | Australia | Perth | $46,700 |
| 29 | United States | Portland (Oregon) | $46,600 |
| 30 | United States | Kansas City | $46,400 |
| 31 | United States | Richmond | $46,200 |
| 32 | United States | Orlando | $45,900 |
| 32 | United States | Cleveland | $45,900 |
| 34 | France | Paris | $45,700 |
| 35 | United States | Memphis | $45,500 |
| 35 | United States | Detroit | $45,500 |
| 37 | United States | Austin | $45,300 |
| 37 | United States | Raleigh | $45,300 |
| 39 | Ireland | Dublin | $44,300 |
| 40 | Germany | Munich | $43,800 |
| 40 | United States | Baltimore | $43,800 |
| 42 | United States | Birmingham | $43,500 |
| 43 | United States | Miami | $42,900 |
| 44 | United Kingdom | London | $42,700 |
| 44 | Denmark | Copenhagen | $42,700 |
| 46 | Canada | Calgary | $42,600 |
| 46 | United States | Cincinnati | $42,600 |
| 48 | Czech Republic | Prague | $42,400 |
| 48 | United States | Phoenix | $42,400 |
| 50 | Netherlands | Utrecht | $41,900 |
| 51 | Germany | Frankfurt | $41,800 |
| 52 | United States | New Orleans | $41,600 |
| 53 | United States | Sacramento | $41,500 |
| 53 | United States | Louisville | $41,500 |
| 53 | Singapore | Singapore | $41,500 |
| 56 | United States | Pittsburgh | $41,400 |
| 57 | Canada | Ottawa | $41,200 |
| 57 | United States | Jacksonville | $41,200 |
| 59 | Netherlands | Amsterdam | $41,000 |
| 60 | United States | St. Louis | $40,900 |
| 61 | France | Lyon | $40,400 |
| 62 | Australia | Sydney | $40,100 |
| 63 | Norway | Oslo | $40,000 |
| 64 | United States | Rochester | $39,900 |
| 65 | Italy | Milan | $39,100 |
| 66 | United States | Virginia Beach | $39,000 |
| 67 | Canada | Toronto | $38,200 |
| 68 | Belgium | Antwerp | $37,900 |
| 68 | United States | Tampa-St. Petersburg | $37,900 |
| 68 | Australia | Brisbane | $37,900 |
| 71 | Canada | Vancouver | $37,600 |
| 72 | Australia | Melbourne | $37,100 |
| 73 | Japan | Nagoya | $37,000 |
| 74 | Switzerland | Zurich | $36,900 |
| 75 | United States | Oklahoma City | $36,800 |
| 76 | Germany | Stuttgart | $36,700 |
| 77 | United States | Providence | $36,100 |
| 78 | Germany | Nuremburg | $35,900 |
| 79 | Japan | Tokyo-Yokohama | $35,700 |
| 79 | China | Hong Kong | $35,700 |
| 81 | Netherlands | Rotterdam-Hague | $35,600 |
| 82 | Spain | Madrid | $35,500 |
| 83 | Italy | Rome | $35,400 |
| 84 | New Zealand | Auckland | $35,300 |
| 84 | Finland | Helsinki | $35,300 |
| 86 | Canada | Edmonton | $35,200 |
| 87 | Greece | Athens | $34,700 |
| 88 | Spain | Bilbao | $34,600 |
| 89 | France | Toulouse | $34,500 |
| 90 | Italy | Turin | $34,200 |
| 90 | United States | San Antonio | $34,200 |
| 92 | Australia | Adelaide | $33,500 |
| 93 | United States | Buffalo | $33,400 |
| 94 | Japan | Shizuoka-Hamamatsu | $32,500 |
| 95 | Spain | Barcelona | $32,300 |
| 96 | Japan | Fukuoka-Kitakyushu | $31,300 |
| 97 | Germany | Cologne | $31,000 |
| 98 | France | Marseille | $30,400 |
| 99 | Germany | Essen-Dusseldorf | $30,200 |
| 100 | Germany | Hannover | $29,900 |
| (1) Purchasing power parity. Metropolitan areas over 1,000,000 population for which data is available. Based upon data from Eurostat, US Bureau of Economic Analysis and Japan Statistics Bureau. | |||
| (2) US data for metropolitan areas from Bureau of Economic Analysis. Scaled to World Bank 2005 GDP PPP figure. | |||
| (3) European data for metropolitan regions from Eurostat regional data. There is no generally accepted metropolitan area definition in Europe. Scaled to World Bank 2005 GDP PPP figure. | |||
| (4) Japan data from Japan Statistics Bureau Scaled to World Bank 2005 GDP PPP figure. | |||
| (5) London metropolitan area is Greater London plus the historic counties of Berkshire, Buckinghamshire, Essex, Herfordshire, Kent and Sussex (including unitary authorities), which are adjacent to the London green belt. Some London metropolitan region GDP estimates exclude suburban areas outside the Greater London Authority. This analysis includes these suburban areas, using GVA scaling from UK National Statistics to estimate non-metropolitan contribution included in Eurostat data (Bedfordshire, Oxfordshire, East Sussex and West Sussex). | |||
| (6) Estimates for the following metropolitan areas scaled to 2005 from 2002 estimates using the closest available change estimate (metropolitan, state/provincial or nation) of the change in GDP per capita (http://www.demographia.com/db-gdp-metro.pdf): Metropolitan areas in Australia and Italy as well as Essen-Dusseldorf, Lyon, Marseille, Dublin, Auckland, Oslo, Zurich, Vancouver, Toronto and Ottawa. | |||
| (7) Metropolitan area data for Calgary and Edmonton estimated from local sources. | |||
Note 1: Another problem with these kinds of rankings is that can be misleadingly unrepresentative. For example, Mercer ranks more than 200 “cities,” which sounds like a significant number. By cities, Mercer appears to mean municipalities (the website is unclear and Mercer has not responded to our request for clarification of what they mean by “city”), of which there are many in all first world metropolitan areas. Some have as few as 50,000 to 100,000 residents. Mercer ranks White Plains, New York (population: 57,000), in the New York metropolitan area, but has no ranking for the many larger cities in the metropolitan area, except for New York itself. Considering that the United States alone has nearly 275 municipalities of more than 100,000 population, the Mercer list appears to be far from comprehensive.
Note 2: The national purchasing power parity conversion factor does not permit comparison of standards of living within nations. For example, anecdotal data would indicate that the cost of living is considerably higher in the San Jose, San Francisco and New York metropolitan areas than in the rest of the country. While not generally available, a purchasing power parity analysis within the United States could show metropolitan areas with lower GDPs per capita to have superior standards of living.
Note 3: The European Union does not formally delineate metropolitan areas, however provides regional data that in most cases is a rough approximation of metropolitan areas.
Wendell Cox is a Visiting Professor, Conservatoire National des Arts et Metiers, Paris. He was born in Los Angeles and was appointed to three terms on the Los Angeles County Transportation Commission by Mayor Tom Bradley. He is the author of “War on the Dream: How Anti-Sprawl Policy Threatens the Quality of Life.”


Thank you very much for
Thank you very much for writing such an interesting article on this topic. This has really made me think and I hope to read more.
http://www.textyourexbackmichaelfiore.com/
Wow, cool post. I’d like
Wow, cool post. I’d like to write like this too – taking time and real hard work to make a great article… but I put things off too much and never seem to get started. Thanks though.
natural whey protein