
For an advanced capitalist society, the United States has a quite high birth rate, and substantial natural increase. Yet despite this, almost a third experienced natural decrease, an excess of deaths over births, over the recent 2000-2007 period. Some counties with natural decrease still grow in population because of sufficient in-migration, but more typically, natural decrease is associated with high levels of out-migration and with long term population decline.
My first map, Figure 1, depicts counties with natural decrease at five levels, with warm colors marking the higher "rates" (actually here, simply the share that natural decrease is of the base population in 2000), and cool colors lower rates, blue being closest to a balance of births and deaths.
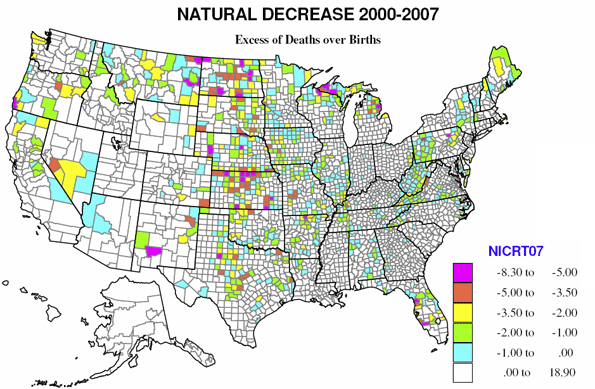
The Great Plains, the part of the country most dependent on agriculture, has led this trend as it has been since probably 1960, with counties from Texas to North Dakota, Montana (and beyond into Canada) experiencing among the highest levels of natural decrease. Others include central Florida, Appalachia, and some interior parts of New England, the upper Michigan to northern Minnesota iron range, and a sizable scatter of counties across the west.
What causes natural decrease? First is a pattern of long term out-migration of the surplus young, who could not be supported by the limited rural economy and other natural resource based industries. Second is the growth of the elderly population from selective migration to amenity retirement areas. Florida is the “flagship” case, but to a lesser degree it occurs in favored local environments in most of the country. Third would be a situation of natural decrease because of unusually high mortality. Fortunately, there is no example of this in the United States.
The geography of natural decrease
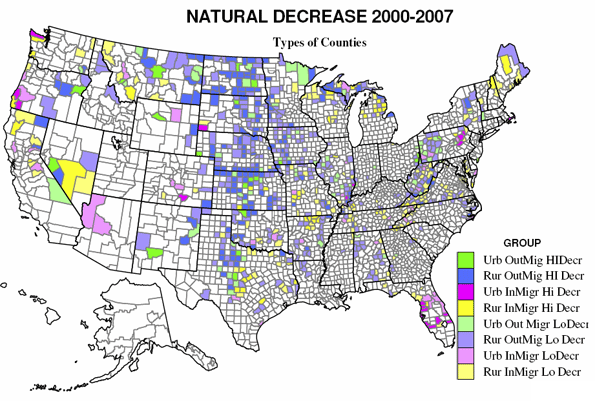
First there is a small set of counties with natural decrease, more deaths over births, but still net positive growth due largely to net domestic in-migration (magenta and yellow on the county types map, Figure 2). The bulk of these counties are retirement amenity areas, mostly but not entirely in the Sunbelt, and mostly but not entirely in the south and west. Another even smaller group is characterized by long term declining industry and mining based economies, but also offers affordable housing stock for second homes and later retirement. We see this especially in Appalachia.
The largest cluster of the first type of places covers a swath of central Florida, including such cities as St. Petersburg, Sarasota, Port Charlotte, Melbourne, Daytona Beach, followed by southwestern Oregon, northwestern Arizona (Prescott, Lake Havasu City), central Colorado (west of Colorado Springs), parts of rural Northern California, Wyoming, South Dakota, Montana and Washington state.
The main cluster of the second type, areas with industrial decline that have become amenity retirement destinations, are in Appalachia, especially the North Carolina - Tennessee border area (Great Smokies), selected counties in northern West Virginia and exurban counties around Pittsburgh. A prominent cluster is the Scranton-Wilkes-Barre, Hazleton area of east central PA. Scattered Midwestern examples include places like Hot Springs, Arkansas, 3 counties in Southeast Illinois, along with areas along Lake Superior, parts of Arkansas as well as on the Texas Gulf coast.
The more rural natural decrease counties with net in-migration (215 counties, yellow on the map) tend to occur in the same regions. The two main “belts” of such counties are retirement and resort counties extending from the central Texas hill country through Ozark plateau and lakes, and again parts of Appalachia. Virginia has the largest number of such counties, some just beyond the commuter zone of Washington. Similar areas occur across the far north, characterized by recreation and retirement as well as ex-logging or mining. A third area includes areas in western Montana, popular with California retirees, and a fourth is far northern CA.
Then there are counties losing population from natural decrease and net internal out-migration. Two-thirds (576) of counties with natural decrease experience this expected pattern of long term decline of resource-based economies. Of these 105 have at least a 50 percent urban population (green on the map), but most (471 of all 861) natural decrease counties are predominantly rural (blue on the map).
The Great Plains, from Texas though Dakotas and eastern Montana to Nebrasla represents the largest region for natural decrease and populatiob loss. represents the largest region for such losses. This is quintessential high plains farm belt, which continues to experience mechanization, loss of local businesses and out migration of the young for at least 80 years now. But although the large majority of rural counties with net out-migration (blue on the map) are in the Great Plains belt, significant numbers also occur in the forest and mining counties in Maine, Michigan, eastern Oregon, northeastern New York, and northern Appalachia.
This leaves an interesting scattering of counties from Texas, northern Louisiana, Arkansas, Alabama, and the North Carolina-Virginia border region. These are mainly farming areas, often with significant (35 to 60 percent) Black population shares, largely elderly, areas somewhat “left behind” in the growth of industrialization and urbanization of the south. This is where young Blacks have left for city opportunities, just as young whites have from the prairies and the mines.
What will the future bring?
I examined maps of counties with 0 to 1% natural increase, or with high shares of the population between 45 and 64, which are plausible candidates for a shift to natural decrease, but also looked at counties with 0 to 1 % natural decrease, which are candidates for a shift to natural increase.
The most likely future areas for a shift to natural decrease include many in a wider Appalachian belt, within the greater Mississippi valley from Louisiana to Canada. Hundreds of these counties have the potential to shift to natural decrease by 2025, as the vanguard of the Babyboomers reach 80. The likelihood of the shift does depend on the proximity of the county to vigorous urban and metropolitan areas and on counties’ relative success or failure at attracting retirees. Other commentators have talked of the “slowdown” of migration to and growth of Florida, and the spread of retiree settlement to many other parts of the country. This is already evident on the map, but it is premature to write off Florida’s appeal to retirees, particularly as house prices there have plunged.
There are also forces that may slow, or even reverse, natural decrease. Northward expansion of the Hispanic population will have the contrary effect of raising birth rates and a shift to natural increase. Some areas that have attracted affluent retiree migrants also could experience sufficient investment to foster more general growth.
At the same time, the retirement geography of the massive Baby Boomer cohort has the potential of redrawing the map. But overall, I believe we will see more counties experiencing natural decrease.
This process has now reached around 800 counties. But we will see more of this when the nation approaches ZPG, zero population growth, perhaps after 2050, in many counties
Richard Morrill is Professor Emeritus of Geography and Environmental Studies, University of Washington. His research interests include: political geography (voting behavior, redistricting, local governance), population/demography/settlement/migration, urban geography and planning, urban transportation (i.e., old fashioned generalist)
References:
Morrill, Richard, 1993, The spread of natural decrease, FOCUS,43- 30-33
Morrill, Richard\, 1994, Aging in place, age specific migration and natural decrease, Annals of Regional Science, 28- 1-26
Cromartie, John and Kandel, William, 2008 Rural population and Migration-Trend 4,Natural decrease on the rise. Economic Research Service,USDA \
Cromartie, John and Nelson, Peter, 2008, BabyBoomer migration and socioeconomic change in “no growth’ counties. Paper, Rural Sociological Society.
Frey, William,, 2004, Generational Pull, American Demographics
Johnson, Kenneth and Beale, Calvin, 1992, Natural population decrease in the United States, Rural Development Perspectives, 8 , pp 8-15
Johnson, Kenneth
Hull, Victor, Retirement choices stretch beyond Florida. 2006,


Erratum
"Yet despite this, almost a third experienced natural decrease"
I think the word "counties" belongs in here.
Dave Barnes
+1.303.744.9024
http://www.MarketingTactics.com