
I nearly fell off my bicycle when I read that driving had declined 43% in the United States and transit use had increased 65%. Australia's The Fifth Estate attributes these figures to Professor Peter Newman of Sydney's Curtin University at an event at the Hassell architectural and urban planning firm offices in Sydney. In speaking about a declining driving trend in Australia, The Fifth Estate reports Professor Newman as saying that:*
"... new research from the United States shows this is not a localised trend – car use in the US has plunged 43 percent and there has been a 65 percent leap in public transport use."
As anyone remotely familiar with US transport trends knows, the statement is erroneous. The driving claim is more than 20 times (2,000%) the reality, while transit has seen no ridership increase remotely approaching 65% since World War II, when gasoline (petrol) and tires were rationed.
Professor Newman is one of the world's leading advocates of compact city policies (urban consolidation or smart growth policies), and was co-author of Cities and Automobile Dependence (with Professor Jeffrey R. Kenworthy). This 1990 volume broke new ground in reporting international transport data (one can take issue with commentary in the book, but the data is solid as have been subsequent revisions under Professor Kenworthy's leadership). Professor Newman has also served as Sustainability Commissioner for the state of New South Wales (Sydney is the capital) and serves on the federal government's Infrastructure Advisory Council.
In view of Professor Newman's prominence, Australian colleagues asked me for clarification on the matter. I contacted Tina Perinotti, author of the story (by whom I had been interviewed while on a national speaking tour of Australia in 2006). She indicated concern said she would investigate it and make any necessary correction. The last I heard, she had been referred to a Brookings Institution publication. I responded that nothing would be found at Brookings to support the absurd notion that driving is down 43% and transit is up 65% (since we all rely on the same authoritative data sources). Approaching one month after publication (July 24), the error has neither been retracted nor clarified.
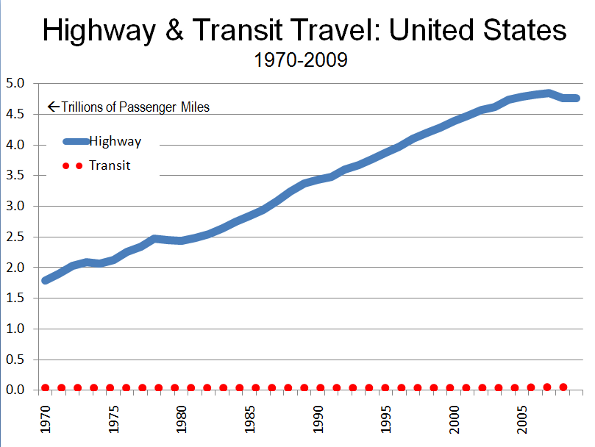
The actual data shows the following:
Driving Trends in the United States: According to the Federal Highway Administration of the United States Department of Transportation, driving is down from its 2007 historic peak. The price of gasoline rose 90% from early 2007 to middle 2008, which combined with the worst economic downturn since the Great Depression (See Note), resulted in a 1.9% decline from 2007 to 2008. By comparison, the largest previous post-war decline in driving was 1.4% during the 1973-1974 energy crisis. The first five months of 2010 indicate a 1.7% reduction in driving from 2007, however driving has been up each of the last three months. The decline in urban areas (where transit operates) is smaller, at 1.1%. Either figure is a far cry from 42%.
Transit Trends in the United States: Transit ridership increased, especially as gasoline prices rose. While skyrocketing gasoline prices produced a modest decline in driving from 2007 to 2008, transit ridership increased more than 5%. In context, however, the ridership increases were inconsequential (Figure), because transit accounts for such a small share of urban travel (under 2%). During the gasoline price spike, only 10% of the loss in urban highway passenger miles was transferred to transit. It seems likely that people just traveled less or combined trips. More recently, transit ridership has begun declining. Data from the American Public Transportation Association indicates that transit ridership (first quarter annualized) has declined 6% from its 2008 peak. Over the same period, urban driving declined by less than one-tenth of the transit rate, at 0.4%.
Trends in Australia: As in the United States, modest driving declines occurred in Australia. According to data from the Bureau of Infrastructure, Transport and Regional Economics, driving declined 0.04% in the five largest capital cities (Sydney, Melbourne, Brisbane, Perth and Adelaide), as gasoline prices increased (from the peak in 2007 to 2008). Over the same time period, transit ridership was up 6%. A more recent annual report by the New South Wales Department of Transport indicated that driving had dropped 1%. However, the three year period covered (July 2006 to June 2009) included the gasoline price spike, which was an important factor in reducing driving. The same report found that automobile ownership in Sydney had increased over the same period, which would seem to evidence the lack of any cultural shift (though cultural shifts are not indicated by miniscule numbers).
It is not surprising that neither Australians nor Americans have seen their streets and highways freed from congested traffic. Indeed, in Sydney one way work trips take just as long as before (34 minutes) and longer than any US metropolitan area except New York.
* Subsequently corrected by The Fifth Estate
-----
Note: For a description of the connection between compact city policies (smart growth), US housing bubble, and subsequent international financial crises, see Root Causes of the Financial Crisis: A Primer.
-----
Photograph: Freeway and transit in Perth, Western Australia (by the author)
Wendell Cox is a Visiting Professor, Conservatoire National des Arts et Metiers, Paris. He was born in Los Angeles and was appointed to three terms on the Los Angeles County Transportation Commission by Mayor Tom Bradley. He is the author of "War on the Dream: How Anti-Sprawl Policy Threatens the Quality of Life.”


Just a note
Wendell:
It was not clear of the data spread for the reduction in driving. For example, are we driving less today as compared to the year 2000? or 1990?.
The reason I ask this is because as you know statistics are often slanted for the cause they are supposed to support. So if you were to base automotive use on how many gallons of gas is being consumed, and as todays vehicles are much more efficient, you could see a huge decrease in gas sales, and relate that to less vehicle miles, but that would not be the case. Do you think that is what is going on?
Just a thought.
Clarification
Rick...
This is simply vehicle miles traveled (VMT). Has nothing to do with fuel usage. VMT peaked in 2007 and was higher than than in 1990 or 2000. You can see the urban data at http://www.publicpurpose.com/ut-usptshare45.pdf
Thank you.
Wendell Cox
Demographia
www.demographia.com