
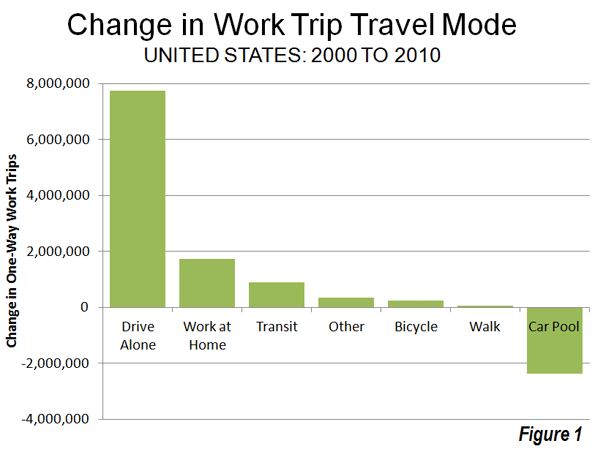
Despite higher prices and huge media hype over shifts to public transit, the big surprise out of the 2010 American Community Survey has been the continued growth over the last decade in driving alone to work. Between 2000 and 2010, driving alone to work increased by 7.8 million out of a total of 8.7 million increase in total jobs. As a result, this use of this mode reached 76.5% of the nation's workers, up from 75.6% in 2000. This is the largest decadal share of commuting ever achieved for this mode of transport.
In view of the much higher gasoline prices that prevailed in 2010, it might have been expected that driving alone would lose market share from 2000 (Figure 1). But this did not --- despite many media and academic claims that would or was already taking place --- occur.
The Census Bureau began compiling data on commuting in the 1960 census. In each census through 2000, commuting data was obtained through the census "long form" questionnaire. During the last decade, however, the Census Bureau has begun an annual survey, the American Community Survey, which includes commuting data and a considerable amount of additional data, and the decennial census survey was discontinued.
Cars Dominate: There have been substantial changes in how the nation travels since the first survey in 1960. In 1960, 64% of the nation's workers traveled by car. Separate data was not obtained for driving alone and carpools until 1980. The 2010 data indicates that 86.2% of employees used cars for the work trip in 2010. This was a slight reduction from 87.9% in 2000. But the anti-automobile crowd should not celebrate; all of the loss was due to a substantial decline in carpooling. In 2000, 12.2% of workers traveled by car pool. This figure dropped to 9.7% in 2010. With the higher gas prices, it might have been expected that carpooling would have become more popular, because of the lower costs from sharing experiences with other workers. This simply did not occur.
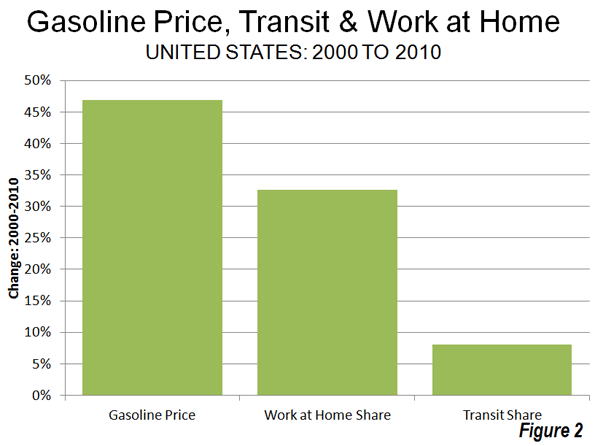
Working at Home: The big winner among the nation's commuting modes was working at home, a large share of which is telecommuting. Working at home increased from 3.3% of the workforce in 2000 to 4.3% of the workforce in 2010, for a market share increase of 33%, Overall 1.7 million more people work at home in 2010 than in 2000. It seems likely that the high gas prices encouraged a more working at home as did the move by companies to offload work to freelancers to reduce their costs or boost efficiency. Over the decade, gas prices increased 46%, adjusted for inflation, while the work at home market share increased 33% (Figure 2).
Further, working at home, as indicated in a previous article, is poised to become the third most popular method of accessing work before 2020, passing transit and trailing only driving alone and carpooling (see Decade of the Telecommute). Working at home might have been much more popular in 1960, when it accounted for 7.2% of employment. But as many home-based industries lost share to chains and malls, this figure fell by more than one-half by 1970 and then fell to 2.2% in 1980. The doubling of the work at home market share since that time, on the other hand, is attributable to the advances in information technology.
Transit: Transit experienced by far its best decade since the Census Bureau began tracking commuting. Transit's long market share slide came to an end, rising from 4.6% in 2000 to 4.9% in 2010. Even so, it might have been expected that a more substantial increase in transit commuting would have occurred as a result of the high gasoline prices. However, only an 8% increase in the transit market share occurred at the same time as gasoline prices increased a real 46%, less in percentage terms than the shift to working at home (Figure 2).
Part of the problem was revealed in a Brookings Institution report. The percentage of metropolitan area jobs that can be reached by transit for the average worker is very low, which seriously limits transit’s potential for commuting use. Brookings data indicates that less than 10% of the jobs in major metropolitan areas can be reached within 45 minutes by transit by the average worker in major metropolitan areas (see Transit: The 4 Percent Solution). This is not only because transit service is infrequent in many parts of metropolitan areas, but also because it operates so much more slowly, on average, than cars. By comparison, the median work trip travel time by people driving alone is 21 minutes.
Transit carried 12.1% of the nation's commuters in 1960 and had fallen to 5.3% by 1990. The results of the last three decades indicate that transit commuting may have stopped declining but has reached a plateau, with only small increase.
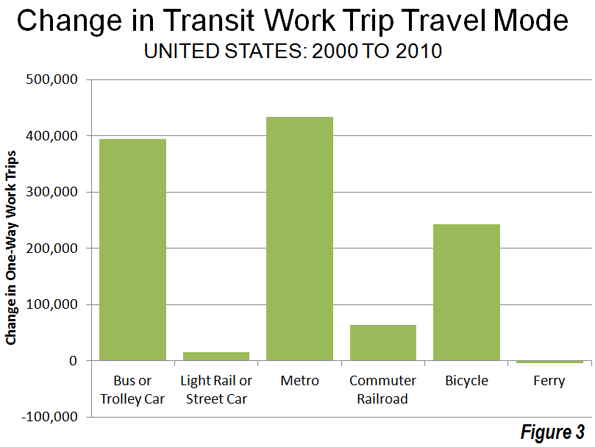
Recent decades have seen establishment and substantial expansion of urban rail systems. A principal rationale for these systems has been reducing traffic congestion, especially during peak hours. The majority of commuting takes place during peak hour and is principally responsible for peak hour traffic congestion. Between 2000 and 2010, Metros (subways and elevated) accounted for 48% of the increase in transit commuting, while buses and a trolley buses accounted for 43%. Light rail (trolleys and streetcars) accounted for less than 2% of the additional transit commuting, despite the fact that light rail has been the dominant form of rail transit expansion (Figure 3).
Bicycling: It was also a good decade for bicycle commuting. Bicycling added nearly 250,000 new commuters and rose from 0.4% of the market in 200 to 0.5% in 2010. The increase in bicycle commuting was 15 times that of light rail. Bicycling was first surveyed by the Census Bureau in the 1980s census, when its market share was also 0.5%.
Walking: There was little change in walking as a form of commuting. In 2000, 2.9% of commuters walked to work, a figure that dropped to 2.8% in 2010. However, walking has suffered even greater losses than transit over the last 50 years. In 1960, 9.9% of commuters walked to work.
The Future? One thing is clear from the data of the last decade. There has been no sea-change in commuting, even with the huge gasoline price increases. Few analysts would have predicted that single-occupant commuting would have increased at a time of both high gasoline prices and high joblessness. Further, as the shift to personal mobility continues, the largest percentage increases will like take place in telecommuting, arguably the most energy-efficient form of transport.
Data from 1960: The table below summarizes work trip access market shares over the 50 years of data collection by the US Census Bureau.
| US Work Access by Mode: 1960-2010 | ||||||
| COMMUTERS | 1960 | 1970 | 1980 | 1990 | 2000 | 2010 |
| Car, Truck or Van | 41,368,062 | 59,722,550 | 81,258,496 | 99,592,932 | 112,736,101 | 118,123,873 |
| Drove Alone | 62,193,449 | 84,215,298 | 97,102,050 | 104,857,517 | ||
| Car Pool | 19,065,047 | 15,377,634 | 15,634,051 | 13,266,356 | ||
| Transit | 7,806,932 | 6,514,012 | 6,007,728 | 5,890,155 | 5,867,559 | 6,768,661 |
| Bicycle | 468,348 | 466,856 | 488,497 | 731,286 | ||
| Walk only | 6,416,343 | 5,689,819 | 5,413,248 | 4,488,886 | 3,758,982 | 3,797,048 |
| Other or Unspecified | 4401718 | 2240864 | 1289613 | 1225420 | 1243866 | 1,595,942 |
| Work at Home | 4,662,750 | 2,685,144 | 2,179,863 | 3,406,025 | 4,184,223 | 5,924,200 |
| Total | 64,655,805 | 76,852,389 | 96,617,296 | 115,070,274 | 128,279,228 | 136,941,010 |
| MARKET SHARE | 1960 | 1970 | 1980 | 1990 | 2000 | 2010 |
| Car, Truck or Van | 64.0% | 77.7% | 84.1% | 86.5% | 87.9% | 86.3% |
| Drove Alone | 64.4% | 73.2% | 75.7% | 76.6% | ||
| Car Pool | 19.7% | 13.4% | 12.2% | 9.7% | ||
| Transit | 12.1% | 8.5% | 6.2% | 5.1% | 4.6% | 4.9% |
| Bicycle | 0.5% | 0.4% | 0.4% | 0.5% | ||
| Walk only | 9.9% | 7.4% | 5.6% | 3.9% | 2.9% | 2.8% |
| Other or Unspecified | 6.8% | 2.9% | 1.3% | 1.1% | 1.0% | 1.2% |
| Work at Home | 7.2% | 3.5% | 2.3% | 3.0% | 3.3% | 4.3% |
| Notes | ||||||
| Other includes taxicabs, motorcycles and other | ||||||
| Blank cells indicate no data | ||||||
| Taxicab included in transit in 1960 | ||||||
| Workers 14 and over, 1960 & 1970. Workers 16 & over, subsequent censuses | ||||||
| US Census Bureau data | ||||||
Wendell Cox is a Visiting Professor, Conservatoire National des Arts et Metiers, Paris and the author of “War on the Dream: How Anti-Sprawl Policy Threatens the Quality of Life”
Photo: Junction of Interstates 110 (Harbor Freeway) and 105 (Glenn Anderson Freeway) in Los Angeles, which carry four varieties of passenger transport, cars, busway, high-occupancy vehicles and light rail (by author).


