Getting the Migration Story Straight: Analysts continue to misunderstand the recent metropolitan area census estimates. Much of the misunderstanding arises from a misinterpretation of a chart produced by the Brookings Institution, which indicates that the rate of population growth has fallen in exurban counties and was, last year, less than the rate of growth in what Brookings calls emerging suburbs and "city/high density suburbs." However, the Brookings chart characterizes only total population growth, which is the combination of the natural growth rate, net international migration and net domestic migration. In other words, the Brookings Institution chart includes both people who move between areas of the United States and the net of those who move from outside the United States, are born or died.
Perhaps the most befuddled was the Arch Daily, which says that "people are leaving the suburbs and once again flocking to the cities..." In fact exurban and suburban areas continue to grow, though their growth rates have fallen. The highly touted decline in exurban growth rates is for one year only (2010-2011) and represents only the first year in the last 20 that the exurban has trailed that of the "city/high density suburbs." It is also the first year out of the last 20 that the "city/high density suburbs" did not trail both the suburbs and exurbs.
However, aggregate growth rates say nothing about moving to or from cities. Only one of the components of population change, domestic migration, can possibility indicate movement from the suburbs and exurbs to the cities. People who migrate from outside the nation, for example, are not moving from suburbs to the city (the suburbs of Paris don't count). People who are born or die are not migrating from the suburbs to the cities (where they might come from or are going has been the source of endless debate through history). The only people who can possibly be moving from suburbs and exurbs to the city are domestic migrants ---people who move within the United states.
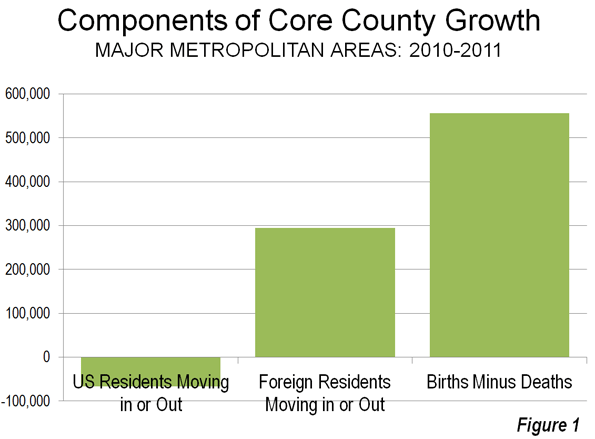
Figure 1 indicates the components of population change in the core counties of the nation's 51 metropolitan areas with more than 1,000,000 population (there are no city level migration data).
- There was a net gain in natural growth of 556,000 (births minus deaths)
- There was a net gain in international migration of 295,000 (people who moved from outside the nation to the core counties.
- There was a net loss in domestic migrants of 67,000. These US residents moved away from the core counties.
As we indicated in Still Moving to the Suburbs and Exurbs: The 2011 Census Estimates, there was net domestic migration to the suburbs and exurbs between 2010 and 2011. There was net domestic migration out of the central counties (there is no "city" migration data). This is illustrated in Figure 2, which has been annotated to make the actual moving of people clear.
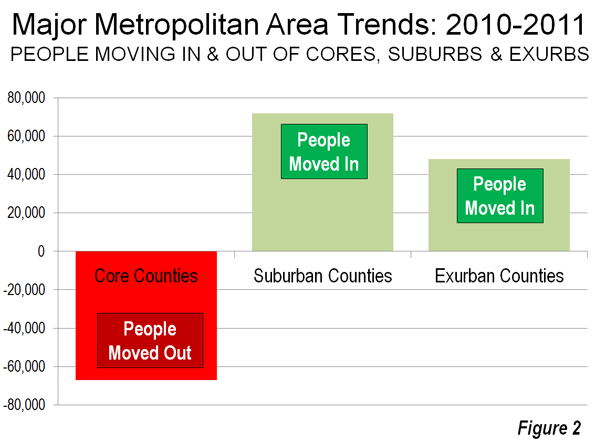
If it should ever occur, it will be very clear when people are moving to the cores from the suburbs and exurbs. There will be PLUS domestic migration numbers to the core counties and MINUS domestic migration numbers from the suburbs and exurbs. Until that time any flocking (though that is too strong a word for current trends) will be away from the cores and to the suburbs and exurbs.
Of course, in the greatest economic downturn in more than 75 years, domestic migration has slowed considerably. It is not surprising, therefore that population growth rates in the exurbs and suburbs have fallen, since far fewer people are moving.
All Domestic Migration was to the Suburbs: Finally, all of the net domestic migration in the nation was to the suburbs and exurbs of the nation's major metropolitan areas (Also see Figure 2).
On the Health of Exurban Housing Markets
On a related subject, University of South Florida Professor Steven Polzin offered an interesting comment on the Planetizen site:
While I have not explicitly researched the distribution of home foreclosures as a function of the transportation costs of residents, I would caution analysts to more fully explore the nature of the housing foreclosure trend before jumping to the assumption that transportation costs were a significant contributor to geographically differential rates of foreclosure. Foreclosures were more prominent in homes purchased more recently relative to the housing crash. These new home purchasers were more often highly leveraged, had little equity in their home, and in many cases younger workers with less job seniority and more susceptible to layoffs. In addition, in fringe areas that had been growing there was a high concentration of homes all purchased recently. Thus, new growth areas were more susceptible to both foreclosures and the cascading effect of home depreciation spreading based on nearby foreclosed properties.
In a new suburb a young financially extended family may lose their job, have no equity in the house and quickly lose their house. Its depreciated value is soon reflected in adjacent appraisals cascading the stress throughout relatively fragile neighborhoods. On the other hand in established neighborhoods only a relatively small share of the homes changed hands near the peak of the building bubble. Thus, many of those homeowners had far more equity in their home and perhaps more job seniority and security enabling them to whether a housing downturn. In addition, the diversity of home ages and types and the less frequent occurrence of foreclosed properties will control the pace at which home value depreciation will cascade through the neighborhood.
If commuting cost was as big a contributor to suburban fringe foreclosure rates then one would have expected downtown condominiums to weather the housing bubble. In many locations like Florida large clusters of new downtown residential properties suffered the same rapid depreciation as did suburban fringe areas. The concentration of new units seemed to be more critical than the location.
Similar sentiments have been posted on these pages from time to time, such as here and here.


Very informative post! There
Very informative post! There is a lot of information here that can help any business get started with a successful social networking campaign!
http://unlockherlegsdownload.com
Great article Lot's of
Great article Lot's of information to Read...Great Man Keep Posting and update to People..Thanks
https://rebelmouse.com/
Thank you again for all the
Thank you again for all the knowledge you distribute,Good post. I was very interested in the article, it's quite inspiring I should admit. I like visiting you site since I always come across interesting articles like this one.Great Job, I greatly appreciate that.Do Keep sharing! Regards,
click here to visit the website
Thanks for sharing excellent
Thanks for sharing excellent informations. Your web-site is very cool. I'm impressed by the details that you have on this web site. It reveals how nicely you perceive this subject. Bookmarked this web page, will come back for extra articles. You, my pal, ROCK! I found simply the information I already searched all over the place and simply couldn't come across. What a perfect web-site.
Victorino Noval Philanthropist
Wow i can say that this is
Wow i can say that this is another great article as expected of this blog.Bookmarked this site..
girlfriend activation system v2 examples
The proposals, however, have
The proposals, however, have drawn significant concern and outright opposition from those who believe a massive coal terminal will diminish air and water quality in the region while increasing noise, congestion and wait times at rail crossings, market research hero, market research hero review, market research hero discount, market research hero bonus, webinar ignition review
Sieu thi mevabe , sua
Sieu thi mevabe , sua Physiolac , sua bot Nestle ,sua tuoi vinamilk cho be