.jpg")
Years ago, when I first started working as a planner for the City of Chicago, my primary responsibility was working with community organizations that received Community Development Block Grant (CDBG) funding for commercial revitalization activities. This being CDBG funding, our work was constrained to areas of the city where 51% or more of households earned less than the median household income for the Chicago metro area. In the early 1990’s, this hardly interfered with our work — outside of the Gold Coast, the Near North Side, Lincoln Park, Lakeview and a few parts of the Northwest and Southwest sides, we were able to grant CDBG funding to virtually the entire city.
Fast forward twenty years. Chicago’s transition from Rust Belt Capital to Global City has been unparalleled. Where there once had been large swaths of middle-class, working-class and impoverished neighborhoods, with high-income enclaves, there are now nearly as many high-income neighborhoods as there are of the other three. Perhaps someone who moved to Chicago post-1995 and lives in one of the up-and-coming areas is vaguely aware of this, but anyone who was here before then is quite right to be astounded.
Despite Chicago’s transformation, it’s been pretty well-documented that not all parts of the city have benefited. The battle over the closing of nearly 50 schools, mostly located in the city’s poorer South and West side neighborhoods, brought this to light, as did Chicago’s high-profile murder and violent crime rates through 2013 (which, to date in 2014, have gone down dramatically). Inequalities and disparities became evident in both areas; University of Chicago graduate student and blogger Daniel Kay Hertz brought the disparities to light with his analysis of violent crime in Chicago. As he said in his piece:
Over the last twenty years, at the same time as overall crime has declined, the inequality of violence in Chicago has skyrocketed. There have always been safer and more dangerous areas here, as there are everywhere; but the gap between them is way, way bigger now than it used to be.
Over the last two decades a new but undefined paradigm has emerged, the one of “Two Chicagos”. This is probably best explained once again by Dan Hertz, who recounted an overheard conversation on the L:
I was on the train earlier this week, and two white men got on and asked their neighbors, who were two black women, how to get to a hotel. The women told them. And then began a sort of stock conversation that Chicagoans have with tourists: How do you like the weather, ha ha? The men, who were from Atlanta, did not like it. Have you been on a subway before? Yes, but not often. Would you come back? Oh, yes. We love Chicago, the men said.
The men reached their station, and left.
One woman said to the other: I hate it when people say that – I love Chicago. No, you don’t. You love downtown and the North Side. The other woman said, Uh huh.
That is a frequent sentiment of those who live on the other side of the invisible divide in Chicago. But what, exactly, is that divide? Where are the boundaries? Exactly how deep are the difference?
I took a stab at trying to figure this out.
I compared some socio-economic statistics for the 56 zip codes in Chicago against medians and averages for the entire Chicago metro area (Indiana and Wisconsin excluded). The differences are stark.
Let’s start by looking at maps of the areas of examination. Here is the seven-county Illinois portion of Chicago’s metro area, with Chicago etched in:

I gathered data for all suburban municipalities and all City of Chicago zip codes within this area, for five variables — population, non-white population percentage, median household income, and median home value, and bachelor’s degree or more for persons 25+. The data comes from the 2011 U.S. Census American Community Survey. After collecting that data, I established an “average of medians” or “average of averages” to get a baseline for the metro area, and an understanding of how jurisdictions or zip codes would compare to one another. One fairly big caveat — an average of medians or average of averages weighs all jurisdictions equally, skewing the numbers higher due to the number of small but well-to-do suburban municipalities. So while the 2011 actual median household income for the seven-county area overall was $61,491, the average of medians was $74,731. But since all data is expressed this way, differences are negated.
Next, I looked for Chicago zip codes that were above the metro area average in at least one of three categories — median household income, median home value, and bachelor’s degree or more for persons 25+. These are the higher income neighborhoods that can be called “Global Chicago”. Within the city, they look like this, in yellow:
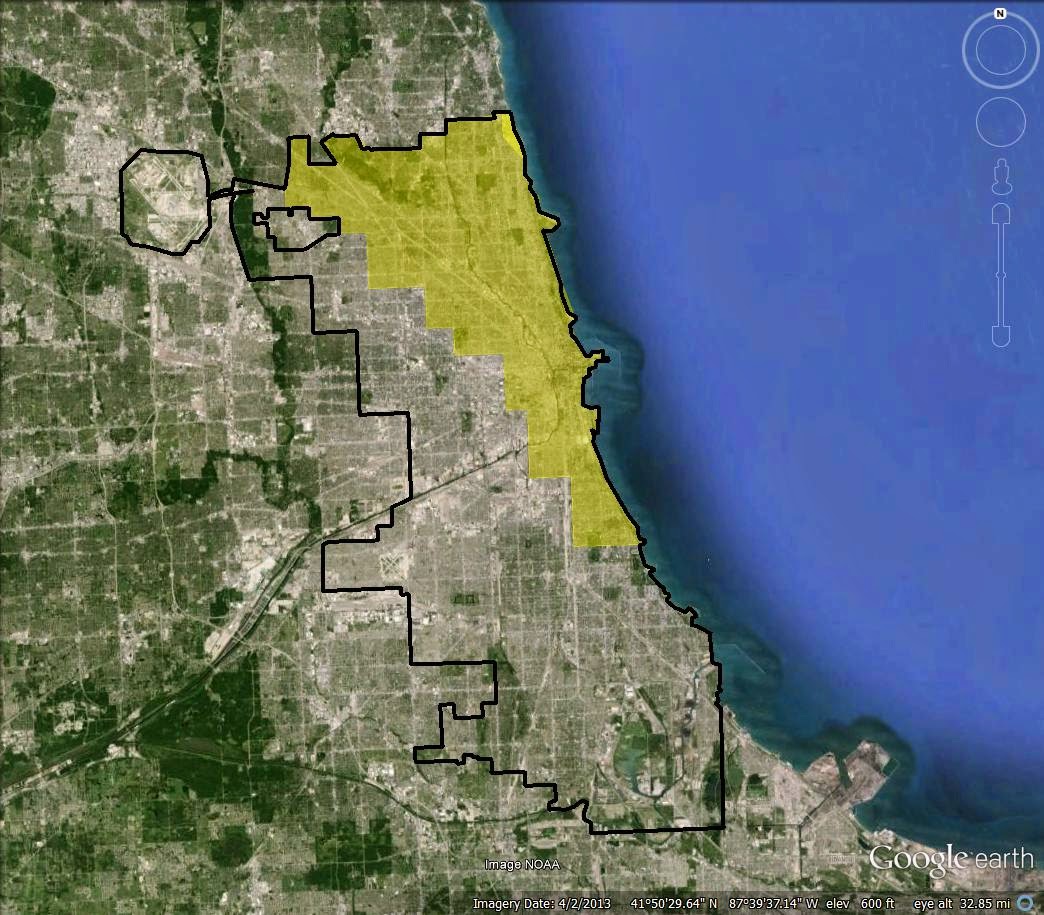
Most Chicagoans would recognize this as the wealthier parts of the city. It stretches from the far Northwest Side eastward to the lake, south to downtown and continuing south before ending in the Hyde Park neighborhood on the South Side. Again, I included all zip codes that were above the metro average for at least one of the three categories I examined, so not all communities are the same. Hyde Park, for example, is here because it has high educational attainment, but is below the average for income and home value. The same applies to Rogers Park and Edgewater on the city’s northern border with Evanston. Jefferson Park, Norwood Park and Sauganash, on the other hand, located on the Northwest Side, rank highly in home value but lower for income and educational attainment.
Taken together, you can see how “Global Chicago” compares with the Illinois portion of the metro area, the metro area excluding Chicago to give you Suburban Chicago, and the balance of the city beyond “Global Chicago” that I’ve called “Rust Belt Chicago”:
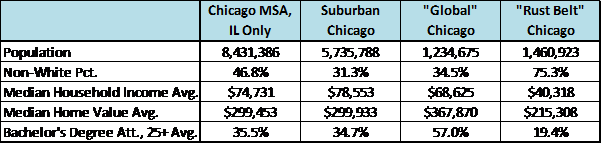
The differences are indeed stark. “Global Chicago” is on par with the Chicago suburbs and the metro area overall in terms of income, and has a lower percentage of minority residents compared to the metro area. Interestingly, “Global Chicago” has a much higher home value and educational attainment when compared to the metro area overall or the ‘burbs. Meanwhile, “Rust Belt Chicago” lags far behind. “Rust Belt Chicago” has a large majority-minority population, has an income nearly one-half as much as the suburban households, and has only one-third as many college graduates as “Global Chicago”.
I decided to take this analysis a little further and determine if there is a core to “Global Chicago”, and how it would compare to the rest of the city. I collected data for zip codes that exceeded the metro average in two or more of the three categories. That produced this map:

And this table:

Here, a “Super Global Chicago” compares favorably with the ‘burbs in terms of income, but far exceeds it in terms of home value and educational attainment. Including some of the peripheral areas of the previous “Global Chicago” with the previous “Rust Belt Chicago” to produce an “Average Chicago” leads to some gains, but it still lags far behind the other slices of the metro area.
Right now, the CNN series “Chicagoland” is doing its best to illustrate the “Two Chicagos” meme, highlighting blues festivals and Stanley Cup championship celebrations on one end of town and school closures and endless crime on another. However, these maps and tables may do a far better job of demonstrating the impact of past and current practices and policies on the city’s landscape. In fact, I think Chicago’s example is one that will serve as a model, for better or worse, for other cities across the nation.
In reality I see the “Two Chicagos” meme as overplayed. Chicago may be better understood in thirds — one-third San Francisco, two-thirds Detroit.
This post originally appeared at Corner Side Yard on March 18, 2014.
Pete Saunders is a Detroit native who has worked as a public and private sector urban planner in the Chicago area for more than twenty years. He is also the author of "The Corner Side Yard," an urban planning blog that focuses on the redevelopment and revitalization of Rust Belt cities.
Chicago photo by Bigstock.


Chicago has very bad
Chicago has very bad suburbans, i was there in 2014 and i was not happy from what i have seen there. But every else is great. oferta
Chicago is Not Detroit
From my perspective Chicago is a one-of-kind truly unique American city. It is in a class by itself and if that were not enough, Chicago is blessed with a fortuitous location on the shore of Lake Michigan which re-enforces it's position of uniqueness.
From the stand point of wealth and income, Chicago is about 1/3 financially well off, about 1/3 poverty stricken and about 1/3 in the mid range between these two socioeconomic levels.
If one has an interest in visiting the great cities of North America, then I can say without fear of legitimate contradiction that one has not seen the great cities of North America until one has also seen Chicago.
1/3 San Francisco, 1/3 Detroit, & 1/3 mini Queens
I applaud your research and this article. However, I think your statement that "Chicago may be better understood in thirds — one-third San Francisco, two-thirds Detroit.." Is off the mark and used to sensationalize the article and bring a "conservative" slant to the article. I feel that nearly everyone writing for Newgeography aspires to work for the Manhattan Institute or some other conservative think tank or publication. Chicago is a target for many reasons.
Chicago is unique to itself, but if you must break Chicago down into generalized thirds and are only discussing the city and not the entire metro then I think you can compare 1/3 of Chicago to San Francisco(although "global" Chicago is more urban, diverse & bustling), 1/3 to Detroit(not quite as blighted though) and 1/3 to a mini Queens( working immigrant Chicago is about half the size of Queens). I say "mini Queens" because the last 1/3 of Chicago is largely working immigrants(largely Hispanic, but also Indian, Asian, & East European). This final working immigrant 1/3 and their neighborhoods do not resemble anything like what is found in crime ridden and blighted Detroit or in the blighted, impoverished and depopulating African American neighborhoods on the far south side Chicago.