
According to the 2011 census, the London commuter shed --- defined here as the of London (the Greater London Authority, or GLA) and the East and Southeast regions of England --- had a 2013 population of 23.2 million, spread over an area of 15,400 square miles (39,800 square kilometers).
For this analysis, the area is divided into five parts, including the central business district (CBD), the balance of Inner London, Outer London, the inner counties, which are largely adjacent to London and the outer counties. Counties are largely only ceremonial at this point and used for geographical convenience. In many counties, unitary local authorities have been established that replace part or all of the previous county geographic authority.
The central business district is situated in a wide corridor on both sides of the Thames River. It is contained in five local authority areas, including the city of London, the city of Westminster and the boroughs of Camden, Southwark and Lambeth. All of central London's eight largest rail stations are in these five areas, and central business district commuters rely to a substantial degree on its suburban rail system.
Inner London roughly corresponds to the London County Council area as it existed before creation of the Greater London Council (GLC) in 1965. Outer London includes the boroughs that were added in the establishment of the GLC which was abolished in 1986. A new, London authority (the GLC) was created in 2000, with a considerably scaled back portfolio of responsibilities, principally transport, police, fire, emergency services and planning. GLA has 33 local authorities, 32 of which are popularly referred to as boroughs, plus the City of London (the one square mile historic core). The local authorities which are responsible for a many local public services, and constituted London's only local government between 1986 and 2000.
The inner counties border on the metropolitan greenbelt, which surrounds London (Note). They are Berkshire Buckinghamshire, Essex, Hertfordshire, Kent and Surrey. The outer counties are Cambridgeshire, East Sussex, Hampshire, Isle of Wight, Norfolk, Oxfordshire, Suffolk and West Sussex.
Distribution of Employment
As of the 2011 census, the local authority areas containing the central business district had approximately 1.4 million jobs, or approximately 15 percent of the jobs in the London area. The rest of GLA, including the balance of inner London and Outer London has 25 percent of the employment. The outer counties have the largest number of jobs, at 2.7 million, comprising 30 percent of London area employment. The inner counties have nearly as many jobs, at 2.6 million, or 29 percent of employment. Thus, the suburban areas outside the Greenbelt have nearly 60 percent of the London area employment (Figure 1).

Where People Live and Work
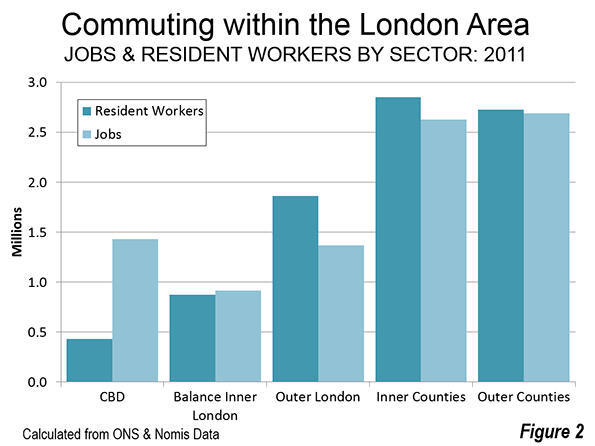
The local authority areas containing the CBD have the greatest imbalance between resident workers and jobs. There are 3.35 jobs for each resident worker in these areas. The ratio of jobs to resident workers is much closer in the balance of Inner London, with a ratio of 1.04 jobs per employee. The least balanced is Outer London, with only 0.73 jobs per employee. The inner counties have the second highest ratio, at 0.93 jobs per employee. Surprisingly, the outer counties have the ratio closest to 1.00, at 0.99 jobs per employee (Figure 2). This parallels our findings of America’s only city with anything like London’s pedigree, New York.
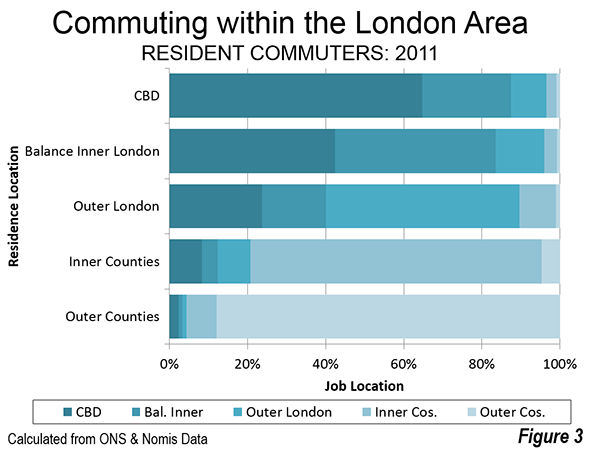
Most employees work in the sector of their residence. About 65 percent of CBD local authority area residents work in the CBD area (Figure 3). Outside-the-greenbelt commuters work in their own sector to a greater degree. In the outer counties 88 percent work in their home sectors, while 75 percent of inner counties commuters work in their own sectors. The balance of Inner London has the lowest percentage of employees working in their own sectors (41 percent), while Outer London is somewhat higher, at 50 percent.
Commuting to Central London
Despite its strong CBD, the London area is anything but monocentric. Approximately 85 percent of London area jobs are outside the central business district. Yet London comparative data from nearly two decades ago placed London's CBD at fourth largest in the world, trailing Tokyo, New York and slightly behind Osaka. With London's strong economic growth since that time, London has probably passed Osaka, which has faced more difficult economic times.
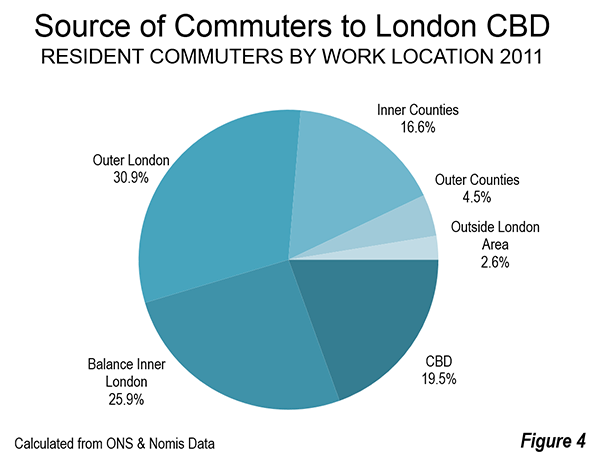
The overwhelming majority of jobs in the London CBD are filled by GLA residents, with more than 75 percent of commuters living in the balance of Inner London or Outer London (Figure 4). This leaves only a quarter living in the exurban areas beyond the greenbelt. Approximately 17 percent of CBD commuters travel from the inner counties, adjacent to the Greenbelt. Only 5 percent travel from the outer counties. Less than three percent of CBD commuters travel from beyond the London area, which may be surprising given the plentiful higher speed (as opposed to genuine high speed) rail services.
How Commuters Travel
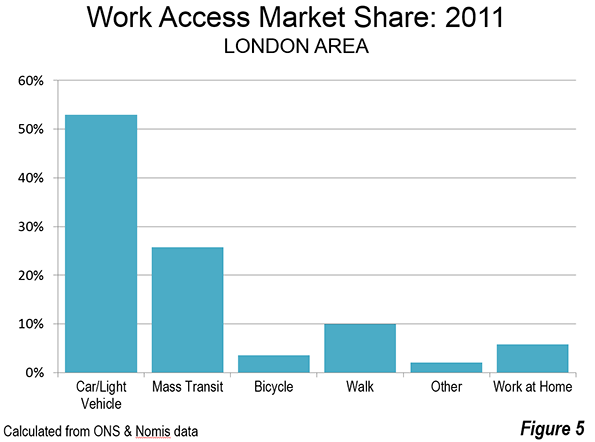
More than half of Londoners commute to work by car or other light vehicles (including car pools). Transit accounts for about a quarter of commuting, while about 10 percent of commuters walk to work. Approximately six percent usually labor mainly at or from home (Figure 5).
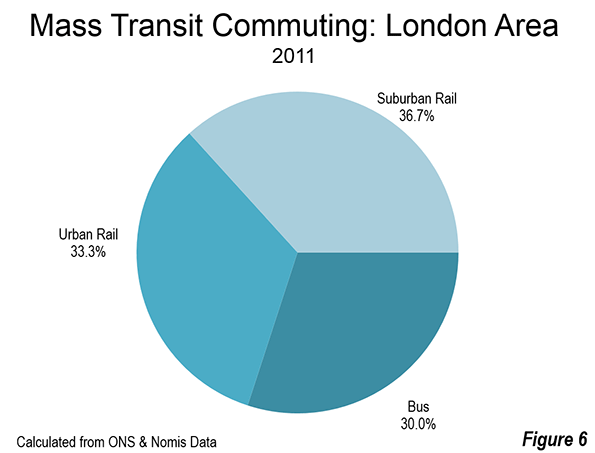
Among mass transit commuters, suburban rail systems account for the largest share, at 37 percent, underground (metro) and light rail 33 percent and buses 30 percent. Over the past three decades there has been a substantial increase in bus ridership, principally from expanded services financed with savings from competitive tendering (also called competitive contracting) and additional services added later in conjunction with London's inner congestion pricing zone. Competitive contracting involves use of competitively selected private companies to operate services. London's "red bus" system --- which is fully integrated in its fare, route structure and vehicle livery with its many double deck buses is virtually all operated by the private sector through competitive tendering.
Minicentric London?
In some ways, London is one of the world's most dispersed cities, largely due to the discontinuous development encouraged by the greenbelt. The greenbelt imposes a substantial distance penalty for commuters from the inner and outer counties to the CBD, whether by car or train. This is in considerable contrast to Western Europe's other megacity, Paris, which is far more compact in its metropolitan development, despite having a considerably weaker CBD. London also demonstrates that the age of the monocentric metropolitan area is largely a thing of the past in high income world cities. With less than one-sixth of metropolitan employment in the CBD, "minicentric" might be a more accurate characterization.
Note: Housing development is prohibited on the metropolitan greenbelt, which surrounds London (GLA). The metropolitan greenbelt covers three times the land area of the GLA. Virtually all population growth over the past 85 years in the London area has occurred outside the greenbelt. The inner and outer counties have added more than 7 million residents over the since the 1931 census, while London itself has added approximately 500,000 residents.
The metropolitan is a cornerstone of London's urban containment policy, which also applies throughout the United Kingdom. Housing development is banned on the greenbelt and the U.K.'s urban containment policy has been associated with a substantial rise in house prices relative to incomes (see: The Barker Review of Housing Supply, the Barker Review of Land Use Planning and The Costs of Smart Growth: A 40 Year Perspective).
Wendell Cox is Chair, Housing Affordability and Municipal Policy for the Frontier Centre for Public Policy (Canada), is a Senior Fellow of the Center for Opportunity Urbanism (US), a member of the Board of Advisors of the Center for Demographics and Policy at Chapman University (California) and principal of Demographia, an international public policy and demographics firm.
He is co-author of the "Demographia International Housing Affordability Survey" and author of "Demographia World Urban Areas" and "War on the Dream: How Anti-Sprawl Policy Threatens the Quality of Life." He was appointed to three terms on the Los Angeles County Transportation Commission, where he served with the leading city and county leadership as the only non-elected member. He served as a visiting professor at the Conservatoire National des Arts et Metiers, a national university in Paris.
Photo: Traffic in London (by author)


typo
15,400 square miles (39,800 square miles).
39.8K square km
Dave Barnes
+1.303.744.9024