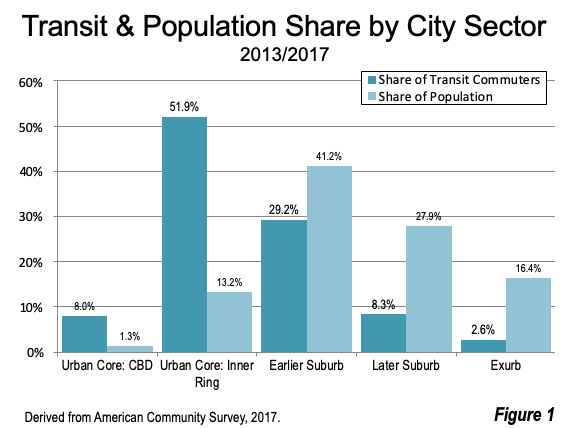
Transit work trip ridership is strongly concentrated in the urban cores of the nation’s 53 major metropolitan areas (over 1,000,000 population), as is indicated by City Sector Model (Note). In the two urban core categories, the Urban Core: CBD and the Urban Core: Inner Ring, the share of total transit work trips is from four to six times the share of population (Figure 1) The percentage of transit commuters in the Urban Core: CBD was six times that of its overall metropolitan population share. Approximately 60% of transit commuters lived in the urban core, which has less than 15% of the population.
Transit Work Trip Market Share by City Sector
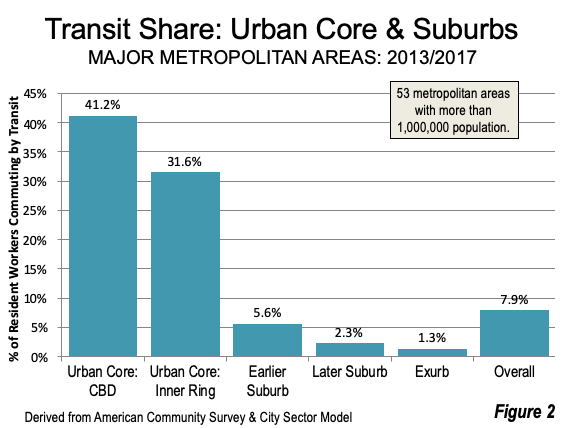
According to American Community Survey 2013 – 2017 data transit work trip market shares were 41.2% in the Urban Core: CBD and 31.6%in the Urban Core: Inner Ring. Transit markets shares dropped off precipitously to between 1.3% to 5.6% in the suburbs and exurbs. The overall one – way transit work trip market share in the nation’s major metropolitan areas (more than 1 million population) was 7.9 percent (Figure 2).
Where Transit is the Strongest: Metropolitan Areas with Transit Legacy Cities
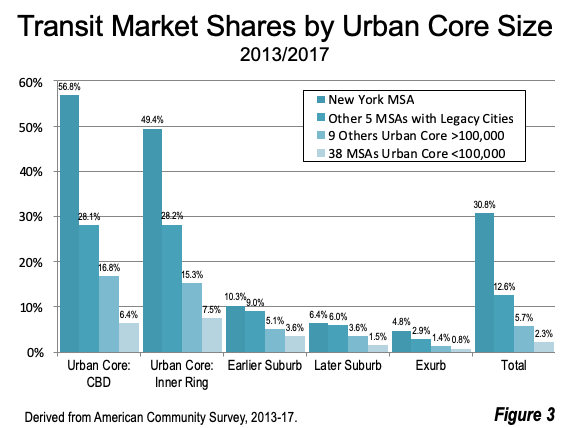
Further, transit commuting is substantially concentrated in just a few major metropolitan areas. Figure 3 divides the major metropolitan areas into four categories. Two of the categories include metropolitan areas with transit legacy cities (core municipalities, not metropolitan areas), the first with the New York metropolitan area and the second with the other five major metropolitan areas with transit legacy cities (Chicago, Philadelphia, San Francisco, Boston and Washington).
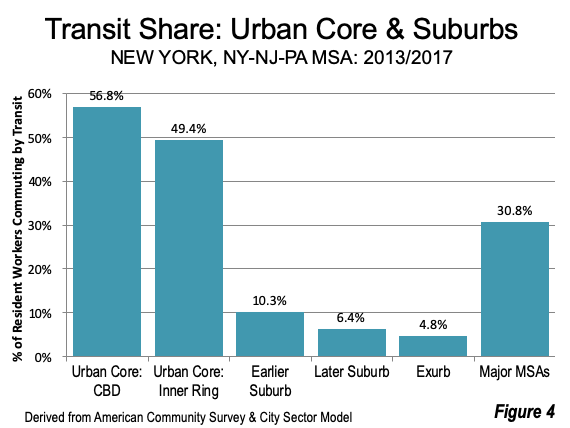
As Figure 4 indicates, New York has by far the strongest transit market shares in the two urban core categories. However, New York’s advantage over the other five MSAs with Legacy Cities is modest in the three suburban and exurban categories.
The third category includes the nine other metropolitan areas with urban cores with more than 100,000 transit commuters. In this category, the urban core residential transit market share tops out between 15% and 17.5 %. The fourth category includes 38 other major metropolitan areas (with smaller urban cores with fewer than 100,000 commuters). In this category transit commuting by urban core residents is below 8%.
Data on Metropolitan Areas with Legacy Cities
In New York (Figure 4), the Urban Core: CBD transit market share is a very strong 56.8 percent, while the Urban Core: Inner Ring 50 percent transit market share is nearly as high, at 49.4 percent. However, suburban and exurban transit shares are much less.
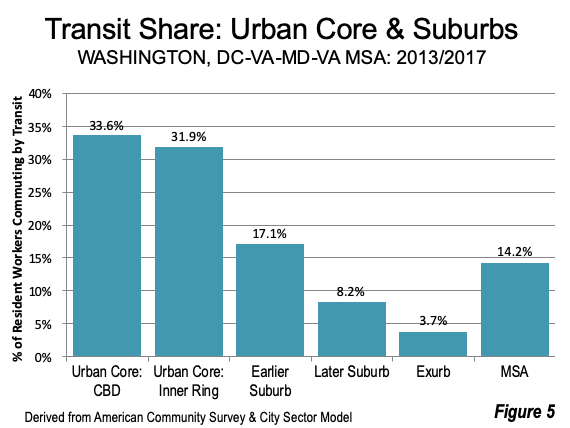
Urban core market shares are considerably lower in the Washington MSA (Figure 5), though second only to New York. In both urban core sectors, transit share is around one third. The transit market share in the Earlier Suburbs is considerably greater in the Washington MSA than in the New York MSA, at 17.1 percent.
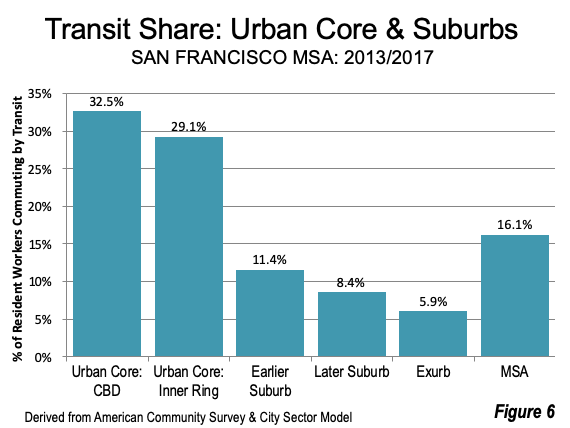
The San Francisco MSA (Figure 6) has nearly as high a transit market share as Washington in the two urban core categories. However, the transit market share falls off to 11.4 percent in the Earlier Suburbs though a stronger share than in New York.
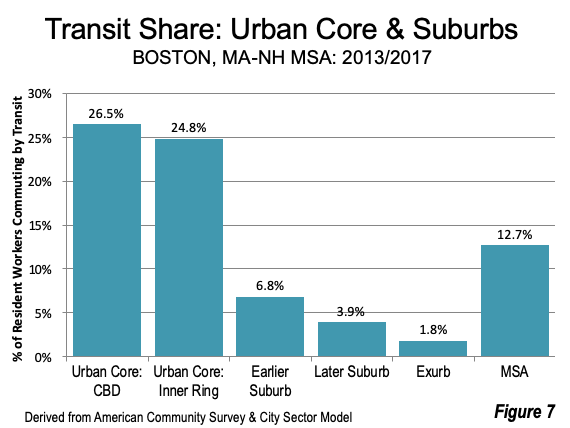
Transit market shares in the two urban core categories are somewhat lower in the Boston MSA (Figure 7), at approximately one quarter. There is a huge drop-off to the Earlier Suburb transit market share of only 6.8 percent.
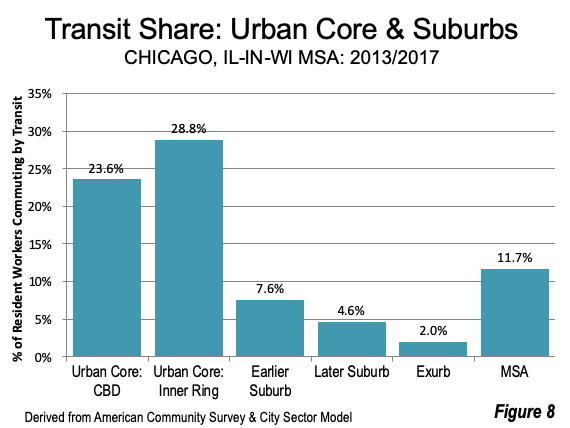
The Chicago MSA, often thought of as the “second city,” does not achieve that in transit (Figure 8). The Urban Core: CBD transit market share is less than 24 percent, though Urban Core: Inner Ring share is nearly 29 percent. Like elsewhere, the Earlier Suburbs have a much lower transit market share at only 7.6 percent.
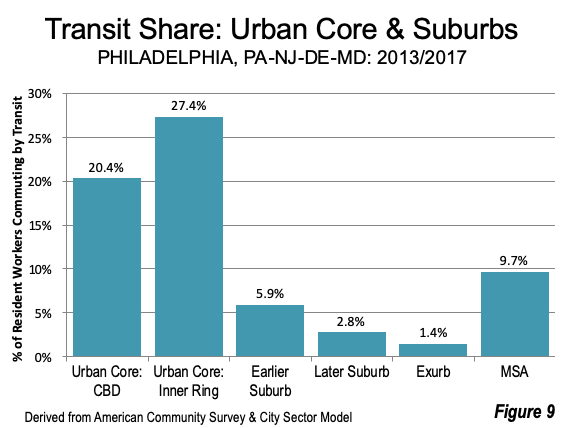
The Philadelphia MSA (Figure 9), like the Chicago MSA, has a lower Urban Core: CBD transit market share than its Urban Core: Inner Ring share. Among the MSAs with transit legacy cities, Philadelphia has the lowest Urban Core: CBD transit market share, but has a higher Urban Core: Inner Ring market share than Boston. And the Philadelphia MSA has the lowest Earlier Suburb transit market share at 5.9 percent.
Transit is About Downtown (and the Urban Core)
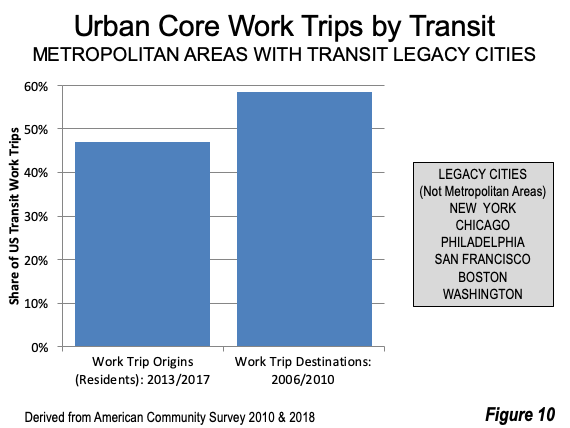
The metropolitan areas with transit legacy cities have 47% of the transit work trip origins (resident workers). However, the concentration is considerably greater with respect to employment locations. About 58% of US transit work trip destinations are in the urban core (Figure 10), about seven times the share of national jobs in the urban cores of these metropolitan areas. This one-quarter higher concentration of work trip destinations illustrates that employment density, rather than residential density is the principal generator of transit commuting – something planners who see dense housing as key to transit success need to start considering.
Note: The City Sector Model classifies small areas (ZIP codes, more formally, ZIP Code Tabulation Areas, or ZCTAs) in metropolitan areas in the nation based upon their function as urban cores, suburbs, or exurbs. The criteria used are generally employment and population densities and the extent of transit use versus car use (Figure 9). The purpose of the urban core sectors is to replicate, to the best extent possible, the urban form as it existed before World War II, when urban densities were much higher and a far larger percentage of urban travel was on mass transit. The suburban sectors replicate the automobile-oriented suburbanization that began in the 1920s and escalated strongly following World War II. The suburban areas are largely within the continuous built-up urban areas, while the exurban areas are generally in the metropolitan areas, but outside the built-up urban areas (The City Sector Model criteria are illustrated in Figure 6 of "Suburbs and Exurbs Dominate House Building Over Six Decades."
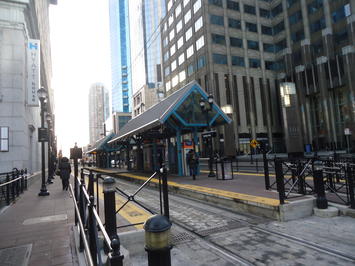
Photo: Hudson-Bergen Light Rail Station, Exchange Place, Jersey City, NJ in the New York urban core (by author).
Wendell Cox is principal of Demographia, an international public policy and demographics firm. He is a Senior Fellow of the Center for Opportunity Urbanism (US), Senior Fellow for Housing Affordability and Municipal Policy for the Frontier Centre for Public Policy (Canada), and a member of the Board of Advisors of the Center for Demographics and Policy at Chapman University (California). He is co-author of the "Demographia International Housing Affordability Survey" and author of "Demographia World Urban Areas" and "War on the Dream: How Anti-Sprawl Policy Threatens the Quality of Life." He was appointed to three terms on the Los Angeles County Transportation Commission, where he served with the leading city and county leadership as the only non-elected member. He served as a visiting professor at the Conservatoire National des Arts et Metiers, a national university in Paris.
