
Reports continue to mount on the decline of New York City through the pandemic months. In a July 2020 post, we summarized the situation:
A “real estate frenzy” has been noted in Connecticut, New Jersey, Westchester County and Long Island, as City residents seek to move to where there is more space and less danger of infection. These areas could become prime attractors of Manhattan employees who want to avoid the crowded offices, crowded transit, crowded elevators and generally overcrowded situations that naturally accompany super-high population and employment densities.
The latest information comes from the American Enterprise Institute (AEI), which reports that “there has been a profound shift in the most popular areas for homebuyers in the New York CSA.”
The CSA is the combined statistical area, which is constituted by the adjacent eight metropolitan (Note) areas forming the New York labor market, in its largest configuration (as defined by the Office of Management and Budget, which also defines smaller labor market: metropolitan areas and micropolitan areas). The New York CSA is comprised of 31 counties in New York, New Jersey, Connecticut and Pennsylvania and covers 12,400 square miles (32,400 square kilometers), slightly less than the area of Massachusetts and Connecticut combined.(in 2010, 58% of the area was rural).
2020 Compared to 2019
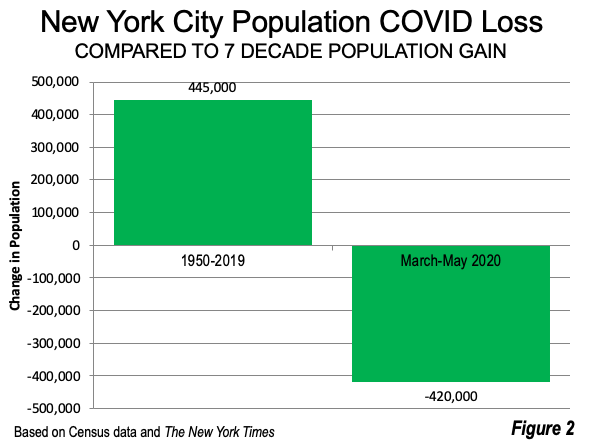
AEI’s Housing Center uses “purchase rate lock” data, which is an indication of house purchases, to estimate trends in counties. Over the last 21 weeks (ended October 18) purchase rate locks have increased in all of the counties except New York (Manhattan), which a purchase rate lock loss of 37% (Figure 1). This development is consistent with a report in The New York Times estimating from mobile phone data that nearly five percent of New Yorkers had left the city which is nearly as many people the city gained over the previous 70 years, with between 2.5 and 3.5 times the rate leaving Manhattan as left the rest of the city (Figure 2).
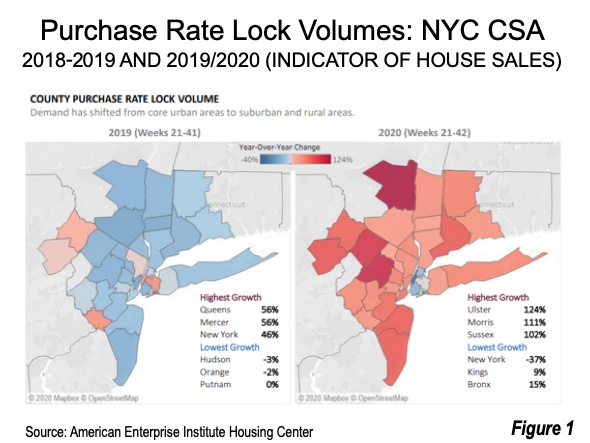
All of the other boroughs gained purchase rate lock volume, with Brooklyn adding 9% and The Bronx gaining 15%. Queens had the third strongest gain in the City.
Larger gains were recorded in all of the suburban counties, as well as Staten Island, much of which resembles New Jersey suburbanization much more than the generally high density that predominates in the other four boroughs. Indeed, Staten Island’s growth appears to be similar to that of adjacent Middlesex County, New Jersey, just across Outerbridge Crossing.
Overall , the greater a county’s distance from Manhattan, the higher the home purchase volume. The greatest increase was in Ulster County (New York), which is two metropolitan areas away from the core New York, NY-NJ-PA metropolitan area. The two are separated by the Poughkeepsie metropolitan area. In Ulster activity is up 124%. Ulster’s county seat, Kingston is a third closer to state capital Albanythan it is to Manhattan (Figure 1, above).
Morris County, New Jersey gained the second most, at 111%. Morris County is located closest to Manhattan among the three leading gainers. But Morris County is hardly an inner ring suburb, with the distance to Manhattan being from nearly 30 to nearly 60 miles.
Sussex County, located in the northwestern corner of New Jersey had the third highest volume, at 102%. Sussex County is just west of Morris County and adjacent to Pike County, Pennsylvania, which is the westernmost outpost of the New York metropolitan area.
There was also strong growth in other New York metropolitan area counties, such as Pike as well as , Monmouth and Ocean in New Jersey. Ocean County is at the southern end of the metropolitan area, reaching to more than 100 miles from Manhattan. Monmouth County is one county closer to Manhattan. Other counties in adjacent metropolitan areas of the CSA had stronger growth. These include Fairfield County, Connecticut, just across the border from New York’s Westchester County and Monroe County, Pennsylvania (seat East Stroudsburg).
Even the long slow growing counties on Long Island, are seeing substantial increases in purchase volume. Consistent with the trends across the rest of the CSA, Nassau County, adjacent to Queens, has seen growth below that of neighboring Suffolk County, which extends more than 100 miles farther east.
Last Year
A year ago, the patterns were very different, with top gains in the city, with Queens having a 56% increase and Manhattan ranked third at 46%. Mercer County, home of New Jersey’s capital, Trenton and Princeton University matched the Queens gain of 56%. Outside of these, the top gainers were Bergen County, across the George Washington Bridge from Manhattan as well as the two Pennsylvania counties, Pike and Monroe, with their superior housing affordability that attracts first home buyers.
Post World War II Trends
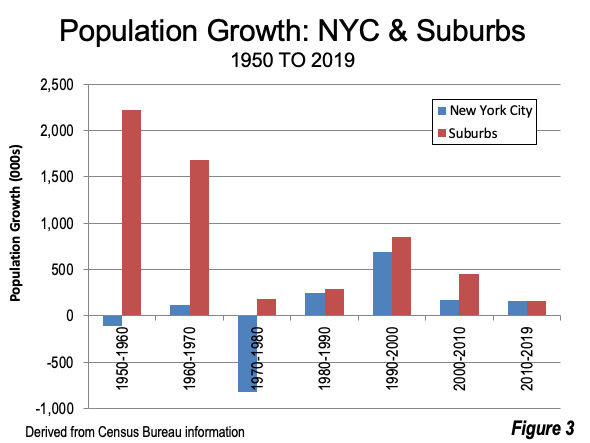
New York’s suburbs dominated metropolitan area growth at least from 1950 to 1980, during which the city gained 800,000 residents and the suburbs 4,000,000. The city did better from 1980 to 2010, when it gained 1.1 million, compared to the suburban 1.6 million. The real turnaround occurred in the 1990s, during much of which Rudy Giuliani was Mayor and more than 600,000 residents were added to the city. Since 2010, and before the pandemic, the City had a gain somewhat greater than the suburbs (Figure 3). However, at no point does any decadal data indicate the often prophesied and reported “return to the City.” Suburbs have continued to dominate in terms of market share and growth.
If the purchase rate lock data and the mobile phone data is predictive, the City could be in for a new exodus, as residents escape to areas more reflective of their preferences given the pandemic world. People are concerned about the City, with its high densities and the related environments in which the pandemic spreads --- enclosed spaces such as elevators, transit, building lobbies, crowded high rises with windows that cannot be opened and overcrowded housing.
What About the Global City?
New York is a global city. It is routinely rated along with London as tops in the world. Both cities might be thought to be seriously compromised at this point. But an escape from New York City does not mean Escape from New York. We are long since past the time that cities, in the functional or economic sense are limited to within boundaries of municipalities. The functional/economic city is the labor market in its largest extent, the CSA.
So long as any exodus from New York City, in jobs or residents, largely consists of movements within the CSA, the functional city of New York can remain a top global city. Manhattan, of course, is usually considered the heart of global New York, But a large number of people working in Manhattan companies reach the city via suburban rail and bus services from their homes in the suburbs. Each day (before the pandemic), more than 300,000 workers reach Manhattan on commuter rail alone, according to the American Community Survey, many from far flung suburbs of Long Island, the Hudson Valley, Connecticut and New Jersey.
Yet the city --- the metropolitan area --- is threatened. Transit ridership remains at least 70% below normal on the New York City Subway and the two MTA suburban rail systems. Even before the pandemic, the metropolitan area was losing large numbers of net domestic migrants to elsewhere in the nation.
New York is well positioned to continue its success as a prime global city. The CSA made an effective transition to telework, as many employees and key personnel were able to work from home. New York seems likely to move, by necessity, to more dispersed residences and employment. Many more people are likely to telework after the pandemic. There are likely to be fewer daily commutes to Manhattan’s job center (which accounts for less than 20% of CSA employment). The other more than 80% of jobs are spread throughout the CSA, with at least 85% of these dispersed to outside job centers. This is likely to be fewer people who travel every day and others who travel less frequently, such as weekly or even more infrequently.
At the same time, preserving New York’s global advantage would be aided if state and local governments undertake significant reforms to reduce their high taxes and land use regulatory reforms that permit development of starter homes on competitively priced urban fringe land. Lack of progress on these fronts could consign the area to further, huge, domestic migration losses to parts of the country with lower taxes and housing affordable to the middle-class.
Note: The adjacent metropolitan areas are Kingston (NY), Bridgeport-Stamford (CT), East Stroudsburg (PA), New Haven (CT), New York (NY-NJ-PA) Poughkeepsie (NY), Torrington (CT) and Trenton (NJ).
Wendell Cox is principal of Demographia, an international public policy firm located in the St. Louis metropolitan area. He is a founding senior fellow at the Urban Reform Institute, Houston and a member of the Advisory Board of the Center for Demographics and Policy at Chapman University in Orange, California. He has served as a visiting professor at the Conservatoire National des Arts et Metiers in Paris. His principal interests are economics, poverty alleviation, demographics, urban policy and transport. He is co-author of the annual Demographia International Housing Affordability Survey and author of Demographia World Urban Areas.
Mayor Tom Bradley appointed him to three terms on the Los Angeles County Transportation Commission (1977-1985) and Speaker of the House Newt Gingrich appointed him to the Amtrak Reform Council, to complete the unexpired term of New Jersey Governor Christine Todd Whitman (1999-2002). He is author of War on the Dream: How Anti-Sprawl Policy Threatens the Quality of Life and Toward More Prosperous Cities: A Framing Essay on Urban Areas, Transport, Planning and the Dimensions of Sustainability.
Photograph: Ulster County (Ashokan Reservoir) by Daniel Case via Wikimedia under CC 3.0 License


