
One of the principal justifications of public subsidies for transit has been to provide mobility for those with low incomes. There continues to be a presumption that low-income workers rely principally on transit for getting to work. Yet, before the pandemic, nearly six times as many major metropolitan area workers in poverty used personal vehicles (cars, vans and trucks) for commuting, as by transit. Only in metro New York did more in-poverty use transit more than personal vehicles.
In 2019, the last pre-pandemic year, a smaller share (percentage of total) of workers in poverty commuted by personal vehicle in all 53 major metropolitan areas than among those not in poverty. The difference was 11.1%.
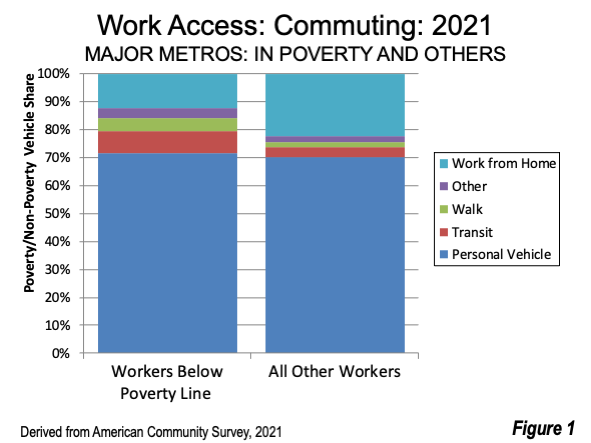
In Poverty Personal Vehicle Share Now Exceeds that of Other Workers
The 2021 data indicates a reversal, as the share of workers in poverty commuting by personal vehicle now exceeds the rate of others. According to American Community Survey data, 71.6% of in poverty workers use personal vehicles, 2.3% above other commuters, at 70.1%. Further, work access modes other than personal vehicles and working from home have diminished to miniscule numbers. Nonetheless transit’s small share among workers in poverty is more than double that of those not in poverty (Figure 1).
In 2021, in poverty workers used personal vehicles more than other workers in 36 of the now 56 major metropolitan areas (Fresno, Honolulu and Tulsa have been added to the list of metropolitan areas over 1,000,000 population between 2019 and 2021).
This change is largely due to the increase in working from home over the pandemic years, as many more affluent personal vehicle users worked from home instead. Generally, the jobs held by lower income workers are less amenable to online work, which has made the in poverty personal vehicle share higher. Even so, in 2021, the work from home share of in poverty workers was 12.4%, more than double the 5.3% rate in 2019. The gain, however, among those not in poverty was much more, quadrupling from 5.7% to 22.4%.
Further these elevated rates of working from home seem likely to be sustained. WFH Research (Jose Maria Barrero, Nicholas Bloom, and Steven J. Davis, 2021) estimates based that 29.1% of all days worked were from home in September of 2022 stabilizing near that figure in recent months.
Metropolitan Area Observations
But even before the pandemic, even metro New York in poverty workers used personal vehicles for commuting more than transit in 2021 (40.0% personal vehicles, 31.6% transit).
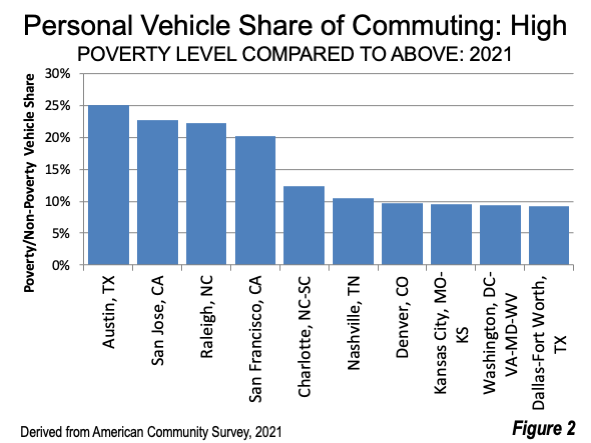
The in poverty vehicle share led that of other commuters most in tech hubs. The largest difference was in Austin, where the personal vehicle share of workers in poverty was 25.1% above that of other workers in 2021 (79.8% compared to 63.0%). In Austin, which approved a large rail transit system expansion, in poverty workers commuted by personal vehicle at more than 100 times the number who used transit. San Jose, Raleigh and San Francisco also had in poverty personal commute rates more than 20% above that of other workers (Figure 2).
The largest personal vehicle commute rate for those in poverty was in Memphis (88.8%), followed by Grand Rapids, Indianapolis and Tulsa. Above 80% personal vehicle rates occurred in 20 metropolitan areas.
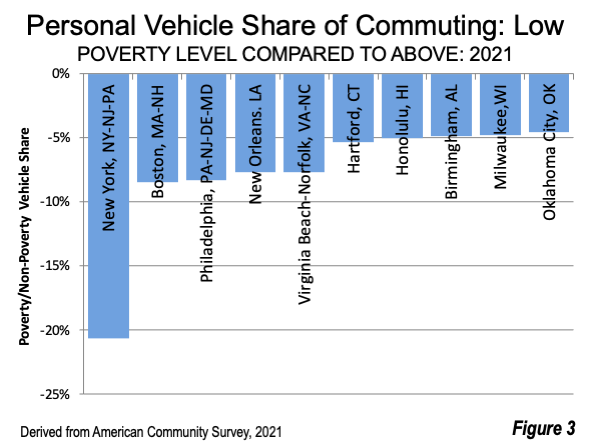
The smallest personal vehicle share compared to non-poverty workers is in New York, 20.7% lower. This is a considerably larger margin than any other metro and is doubtless related to the far larger transit system in New York compared to the rest of the nation. Boston, Philadelphia, New Orleans and Virginia Beach-Norfolk have between 8.4% and 7.7% lower in poverty commute rates than that of other workers (Figure 3).
Metro New York has the lowest in poverty personal vehicle commute share, at 40.0%. Other low ranking metros are much higher than New York. The in poverty personal vehicle share was 61.6% in Boston with Philadelphia, Washington, San Francisco, Seattle and Minneapolis-St. Paul, all with shares less than 70%.
Detailed data is in the table below.
Reducing Poverty
The great advantage of personal vehicles for workers in poverty is that they provide access to far more jobs than transit. Further, travel times to nearly all jobs are less than travel time by transit. Minimizing travel times, while maximizing access to employment means more time for other activities and leisure. Further a wider range of jobs available increases the potential for career advancement, which can be an important factor in escaping poverty. There are few, if any, economic objectives more important than eradicating poverty. One of the best ways to do that is to make as many jobs as possible accessible within the broadly accepted goal of 30-minutes, This requires those in poverty, like everyone else, to have access to personal vehicles.
Wendell Cox is principal of Demographia, an international public policy firm located in the St. Louis metropolitan area. He is a founding senior fellow at the Urban Reform Institute, Houston, a Senior Fellow with the Frontier Centre for Public Policy in Winnipeg and a member of the Advisory Board of the Center for Demographics and Policy at Chapman University in Orange, California. He has served as a visiting professor at the Conservatoire National des Arts et Metiers in Paris. His principal interests are economics, poverty alleviation, demographics, urban policy and transport. He is co-author of the annual Demographia International Housing Affordability Survey and author of Demographia World Urban Areas.
Mayor Tom Bradley appointed him to three terms on the Los Angeles County Transportation Commission (1977-1985) and Speaker of the House Newt Gingrich appointed him to the Amtrak Reform Council, to complete the unexpired term of New Jersey Governor Christine Todd Whitman (1999-2002). He is author of War on the Dream: How Anti-Sprawl Policy Threatens the Quality of Life and Toward More Prosperous Cities: A Framing Essay on Urban Areas, Transport, Planning and the Dimensions of Sustainability.
Photo: Downtown Austin, metropolitan area with the highest personal vehicle commuting share among workers in poverty relative to all other workers. Source: Wikimedia under CC 4.0 License
Table 1 (back to reference)
| In Poverty Personal Vehicle Shares Compared to All Others: 2021 | ||||||
| Metropolitan Area | In Poverty Personal Vahicle Share | Rank | All Others Personal Vahicle Share | Rank | In Poverty Vehicle Share Compared to All Others | Rank |
| Atlanta, GA | 77.5% | 27 | 71.9% | 37 | 7.8% | 13 |
| Austin, TX | 78.9% | 25 | 63.0% | 50 | 25.1% | 1 |
| Baltimore, MD | 70.2% | 49 | 71.4% | 41 | -1.7% | 38 |
| Birmingham, AL | 80.1% | 19 | 84.2% | 4 | -4.9% | 49 |
| Boston, MA-NH | 55.8% | 55 | 61.0% | 52 | -8.4% | 55 |
| Buffalo, NY | 76.4% | 30 | 79.8% | 13 | -4.2% | 45 |
| Charlotte, NC-SC | 80.1% | 18 | 71.4% | 42 | 12.3% | 5 |
| Chicago, IL-IN-WI | 70.2% | 48 | 68.6% | 45 | 2.3% | 28 |
| Cincinnati, OH-KY-IN | 75.7% | 34 | 79.1% | 17 | -4.2% | 46 |
| Cleveland, OH | 76.6% | 29 | 78.7% | 19 | -2.6% | 41 |
| Columbus, OH | 75.4% | 35 | 73.0% | 34 | 3.3% | 25 |
| Dallas-Fort Worth, TX | 82.9% | 8 | 75.9% | 30 | 9.2% | 10 |
| Denver, CO | 73.6% | 39 | 67.0% | 47 | 9.8% | 7 |
| Detroit, MI | 81.4% | 12 | 76.5% | 28 | 6.4% | 16 |
| Fresno, CA | 81.5% | 11 | 84.4% | 3 | -3.5% | 43 |
| Grand Rapids, MI | 86.2% | 2 | 81.9% | 8 | 5.3% | 20 |
| Hartford, CT | 70.7% | 45 | 74.7% | 32 | -5.4% | 51 |
| Honolulu, HI | 73.6% | 38 | 77.5% | 23 | -5.0% | 50 |
| Houston, TX | 80.3% | 17 | 79.5% | 15 | 1.0% | 34 |
| Indianapolis. IN | 85.8% | 3 | 79.2% | 16 | 8.3% | 11 |
| Jacksonville, FL | 82.5% | 10 | 78.1% | 21 | 5.6% | 17 |
| Kansas City, MO-KS | 84.2% | 6 | 76.9% | 27 | 9.6% | 8 |
| Las Vegas, NV | 79.5% | 23 | 81.0% | 11 | -1.8% | 39 |
| Los Angeles, CA | 70.4% | 47 | 71.7% | 38 | -1.9% | 40 |
| Louisville, KY-IN | 82.6% | 9 | 81.5% | 9 | 1.4% | 33 |
| Memphis, TN-MS-AR | 88.8% | 1 | 85.6% | 1 | 3.7% | 23 |
| Miami, FL | 75.1% | 36 | 78.2% | 20 | -4.0% | 44 |
| Milwaukee,WI | 73.4% | 40 | 77.1% | 25 | -4.8% | 48 |
| Minneapolis-St. Paul, MN-WI | 69.4% | 50 | 68.8% | 44 | 0.9% | 35 |
| Nashville, TN | 84.1% | 7 | 76.2% | 29 | 10.4% | 6 |
| New Orleans. LA | 76.3% | 31 | 82.6% | 7 | -7.7% | 53 |
| New York, NY-NJ-PA | 40.0% | 56 | 50.5% | 56 | -20.7% | 56 |
| Oklahoma City, OK | 80.3% | 16 | 84.1% | 5 | -4.5% | 47 |
| Orlando, FL | 81.1% | 14 | 77.0% | 26 | 5.4% | 18 |
| Philadelphia, PA-NJ-DE-MD | 61.6% | 54 | 67.2% | 46 | -8.3% | 54 |
| Phoenix, AZ | 75.9% | 33 | 72.1% | 36 | 5.4% | 19 |
| Pittsburgh, PA | 72.4% | 44 | 72.7% | 35 | -0.5% | 37 |
| Portland, OR-WA | 70.4% | 46 | 65.2% | 49 | 8.0% | 12 |
| Providence, RI-MA | 80.4% | 15 | 79.0% | 18 | 1.8% | 32 |
| Raleigh, NC | 80.0% | 20 | 65.4% | 48 | 22.2% | 3 |
| Richmond, VA | 79.2% | 24 | 73.5% | 33 | 7.7% | 14 |
| Riverside-San Bernardino, CA | 84.8% | 5 | 83.1% | 6 | 2.1% | 29 |
| Rochester, NY | 76.9% | 28 | 79.6% | 14 | -3.4% | 42 |
| Sacramento, CA | 76.2% | 32 | 71.6% | 39 | 6.5% | 15 |
| St. Louis,, MO-IL | 79.6% | 22 | 77.7% | 22 | 2.5% | 27 |
| Salt Lake City, UT | 72.7% | 43 | 71.5% | 40 | 1.8% | 31 |
| San Antonio, TX | 81.4% | 13 | 79.8% | 12 | 1.9% | 30 |
| San Diego, CA | 73.2% | 41 | 70.7% | 43 | 3.5% | 24 |
| San Francisco, CA | 64.5% | 52 | 53.6% | 55 | 20.3% | 4 |
| San Jose, CA | 72.9% | 42 | 59.4% | 53 | 22.8% | 2 |
| Seattle, WA | 64.6% | 51 | 61.5% | 51 | 5.0% | 21 |
| Tampa-St. Petersburg, FL | 77.8% | 26 | 74.9% | 31 | 3.8% | 22 |
| Tucson, AZ | 79.6% | 21 | 77.2% | 24 | 3.2% | 26 |
| Tulsa, OK | 85.2% | 4 | 84.5% | 2 | 0.8% | 36 |
| Virginia Beach-Norfolk, VA-NC | 74.9% | 37 | 81.1% | 10 | -7.7% | 52 |
| Washington, DC-VA-MD-WV | 63.6% | 53 | 58.1% | 54 | 9.3% | 9 |
| Major Metropoltian Areas | 71.8% | 70.0% | 2.4% | |||
| Derived from American Community Survey 2021 | ||||||


Vehicle Ownership
What do the numbers show for % of those below poverty line who have possession of a vehicle(s)? Has this grown in recent years?