NewGeography.com blogs
In the late sixties, India was the poster child of Third World poverty. In 1965, the monsoon rains failed to arrive, food production crashed, and much of the country was on the brink of starving. Asked for help, President Lyndon Johnson is reported to have told an aide, "I'm not going to piss away foreign aid in nations where they refuse to deal with their own population problems." Johnson came around, but by the end of the decade India was viewed in the West as, at best, a basket case and, at worst, a "population bomb" that threatened the entire planet.
Given this history, it's hard not to see the success India has had feeding its people and slowing population growth as the finale to a Bollywood movie — one most Americans stopped watching in 1970. "In a recent exercise," Stanford's Martin Lewis writes in a new article for The Breakthrough, "most of my students believed that India’s total fertility rate was twice that of the United States. Many of my colleagues believed the same. In actuality, it is only 2.5, barely above the estimated U.S. rate of 2.1 in 2011, and essentially the replacement level."
What did it? Lewis created a series of fascinating maps comparing Indian fertility rates to per capita wealth, female education level, electrification, access to TV, and other metrics to answer this question. His first map is one of the most striking. It shows the entire southern half of the country, plus the northern pan handle, as having fertility rates below replacement levels.
Wealth, electricity, education, and moving to the city are all loosely correlated with lower fertility, but the strongest correlation is watching television. "The map of television ownership in India," writes Lewis, "does bear a particularly close resemblance to the fertility map." He notes that two Indian states with a low level of female education, which is traditionally inversely correlated with low fertility, still had low fertility rates, a fact that may be explained by its high levels of TV penetration. Lewis bolsters his argument by pointing to a study from India that found declining fertility after cable TV was introduced into poor neighborhoods.
How does TV act as a contraceptive? Lewis notes it may be because "many of its offerings provide a model of middle class families successfully grappling with the transition from tradition to modernity, helped by the fact that they have few children to support." It may not be TV generally, but rather soap operas specifically that paint a vision for poor women of how much better life with fewer kids might be.
Maybe the reason the West has been so slow to appreciate this Indian success story, Lewis speculates, is because it contradicts everything we've come to believe about overpopulation. Back in the late sixties, some prominent Western ecologists called for the sterilization of Indian men and the halting of food aid, so as to not prolong the suffering. A book called The Population Bomb that proposed these things sold four million copies.
Hopefully now, anyone concerned about both human development and the environment will come to see electricity, rising wealth for the poor, and even TV not as anathema to human development but, at least in many parts of the world, essential to it.
Read the article at The Breakthrough: "Population Bomb? So Wrong, How Electricity, Development, and TV Reduce Fertility"
Toronto has experienced a virtual explosion in high rise condominium construction in recent years, especially in the downtown area. According to Bloomberg, Toronto has the largest number of high-rise condominium towers under construction in the world.
However concerns are being expressed that the market may be saturated and that a housing bubble is developing. The Toronto Starreports that new condominium sales declined 55 percent in the first quarter of 2013, compared to last year.
At the same time, a huge number of new condominium units is under construction in Toronto. According to The Star, 57,000 units were being built during the first quarter. The first quarter build rate is reported as the largest rate ever. For their part, builders have scaled back plans for new towers
Who is Buying?
In an article entitled, “Toronto Condo Investors Under Water,” the Toronto Condo Bubble|Toronto Housing Bubble website (subtitled Largest Housing Bubble Except for Vancouver of Course) asked: “… if condo living is the way of the future, then why is it that the majority of people who buy condos never actually live in them?”
The question was in the context of a report by Scotiabank that between 45% and 60% of Toronto condominium purchasers were investors, rather than people who actually intended to live in the housing.
Single Family Housing in Toronto: The Holy Grail
At the same time, The Star points to indicators that the single family housing market retains considerable strength. Part of the reason is that this most desired type of housing is made far more difficult to build as a result of provincial land-use policies (urban containment, including the Toronto "greenbelt").According to The Star, "That’s made detached homes, in particular, the coveted Holy Grail of housing."
Despite the explosion in condominium units, Statistics Canada data indicates that 71 percent of net new occupied housing in the Toronto metropolitan area was detached between 2006 and 2011.
These market dynamics, rising detached house prices relative to incomes and heightened speculation are predictable outcomes of urban containment (land rationing) policies.
Each year, chiefexecutive.net ranks states based upon their business competitiveness. The latest rankings have just been published in 2013: Best and Worst States for Business.
Texas on Top: For the 9th Year in a Row
For the ninth year in a row, chiefexecutive.net ranks Texas as the most business friendly state. Noting the Texas cost of living advantage, chiefexecutive.net points out that “Young programmers and engineers can actually afford to live well in Austin, where the housing cost index is 300 percent lower than in San Francisco.”
It is not surprising that Austin has emerged as the fastest growing metropolitan area in the United States adding 3.1 percent to its population annually since 2010. This is an astounding rate of growth --- twice that of the San Jose IT behemoth, which at current rate of growth will fall behind Austin in population by 2015. Austin’s growth rate is faster than some of the fastest growing developing world cities, such as Mumbai, Dhaka and Manila.
However there is much more to Texas Austin. Dallas-Fort Worth is the fastest growing metropolitan area with more than 5 million people in the high income world, though at an average annual growth rate since 2010 of 1.9234 percent retains only a narrow lead over similar sized Houston (1.9227 percent). Smaller San Antonio is growing marginally more quickly both Dallas-Fort Worth and Houston (though less than 2 percent).
Texas was joined in the top five by the South’s Florida, North Carolina and Tennessee, as well as Indiana, from the Midwest. Three of the top five (Texas, Florida and Tennessee) do not have a state income tax and chiefexecutive.net notes that other states are looking at tax reform that would improve the business climate.
California: Bringing Up the Rear for the 9th Year in a Row
Just as predictably as Texas ranking first, California has secured the bottom position for the ninth year in a row. A California CEO told chiefexecutive.net“On any particular element, if New Jersey is an ‘8’ on the pain-in-the-ass scale, California is a ‘9 … It’s an ungovernable state, and there’s no movement that will change that, though there are people who want to…”
Nearly as predictably, California is joined in the bottom five by older northeastern states New York, New Jersey and Massachusetts as well as Illinois, from which, like California, hundreds of thousands, even millions of people have fled since 2000.
The complete state rankings can be viewed at http://chiefexecutive.net/best-worst-states-for-business-2013.
There have been two universal reactions to my announcement that I was going to move from Portland to the Midwest: surprise and disbelief. But I also found a number of people who, if given a few moments to find clear and honest footing in the conversation, could see through the self-absorbed mental fog that covers the city in equal measure to the grey rain clouds and tells its inhabitants every day that Portland is the most amazing possible place in this country to live. The amount of media devoted to reinforcing this idea is overwhelming in the sense that I believe it has overwhelmed people’s ability to have their own thoughts and identity in Portland. Instead they have a Portland identity…because they live in Portland and that is what defines them.
On the surface, Portland has many progressive aspects. Sustainability and the “greening of the city” stand front and foremost as two easily recognized. Curbside recycling and composting, increasing investment in bicycle transportation, native gardening, and urban farming. There is an intense concentration of a wide range of alternative health practitioners. Artisan craftspeople abound, creating specialty foods and other handcrafted products. “Shop local” is the resounding cry to support small businesses, and farmers markets adorn every neighborhood in the summertime.
Idyllic as this sounds, there is a less appealing aspect to this picture. As Portland concentrates is cultural practices into a few baskets, the proliferation of other ideas diminishes. Ten years ago I would have characterized Portland as a place that had progressive perspectives. Now I would characterize Portland as a place with few ideas, all perpetually reinforced and more deeply ingrained every day. People regurgitate a handful of versions of the same thoughts in ever narrowing expressions. Everywhere you look it is repetition of the same ideas, whether it be on politics, design, or social culture. People strive to look the same, to dress the same, and to have the same lifestyle. It is so pervasive, that women within a 30 to 40 year age range may display similar choices in hair, dress, and accessories. What began as a city with progressive and forward looking ideas to develop a new urban course has become a closed container of cultural conformity. There is a new cookie cutter in Portland, and it is young, alterna-hip, and white.
I grew up in a place like this…it is called Orange County.
Sweeping shocked gasps aside, this comparison is worth a long pause to consider. Stripping away the key difference between Multnomah and Orange County of political affiliation, with Orange County being a historic Republican stronghold and Portland staunchly Democrat, these two counties have some key cultural similarities all hinging on a pivotal word used above: conformity. Conformity of dress, thought, and mannerisms, shared ideas and ideals, and a strong attitudinal belief that there is a “right” or “correct” way to be and to appear to others. There is also limited interest or investment in the arts, creative, innovative, or intellectual development. Just because the surface ideals these two places seem extremely different from each other, does not mean that they don’t breed the same obedience to a self-referencing norm within themselves. And by perpetuating their particular cultures and tailoring their environments to fit with a narrow range of ideals, the inhabitants of these areas increasingly live on the margins of reality and instead inhabit a fabricated cocoon of their own self-rewarding design.
What disturbed me most about Portland in the months leading up to my decision to leave was the increasingly strong social culture of invisibility. I am referring to the tendency of people in Portland to not acknowledge the physical presence of other people around them in close proximity. This can easily be seen by the increasing tendency of people to brush past you without making eye contact or saying “excuse me” and instead being intensely focused on some spot just beyond your left shoulder. But it manifests in countless other ways: letting dogs off leash (and not picking up after them), ignoring red lights and stop signs, allowing children license to act out without discipline in the presence of other adults.
In this city where conformity to a particular identity is so strong, people no longer see each other as people. People come in and out of your field of vision as an object to be ranked according to usefulness to you, and invariably avoided, ignored and dismissed the majority of the time. It is unpleasant, unsettling and dehumanizing. The countless tiny social interactions we have with other people throughout the day are the glue that hold us together as a community and keep us from being automatons randomly bumping into one another like the balls in a pinball machine. This critical stickiness in Portland is dissolving rapidly. As people lose the ability to engage and connect with one another, there appears to be an increasingly growing level of resentment, frustration and anger brewing under the surface of social interactions. Not just interactions where overt conflict is involved, but all of them. Because it feels like they all contain some level of conflict just by the occurrence of people being together in a place, time and circumstance.
There is little likelihood that I would ever have been physically assaulted in Portland. But I think there is a pretty strong likelihood that if I were physically assaulted that no one around me would react or get involved or help. Because chances are, I wouldn’t even be seen.
When confronted with difficult situations or challenging environments, often it is heard “it’s the people that keep me here…keep me working, living, etc. in this place despite its shortcomings”. In Portland, the situation is reversed….the environment is being made increasingly pleasant and comfortable, but it is the people that make it so difficult to live there.
Read Jennifer Wyatt’s blog about her cross country move at isaymissourah.wordpress.com.
I recently looked at the changes in jobs in metro areas for 2012. Here’s a follow-on look at unemployment. First a look at the national unemployment rate picture, which has improved remarkably.
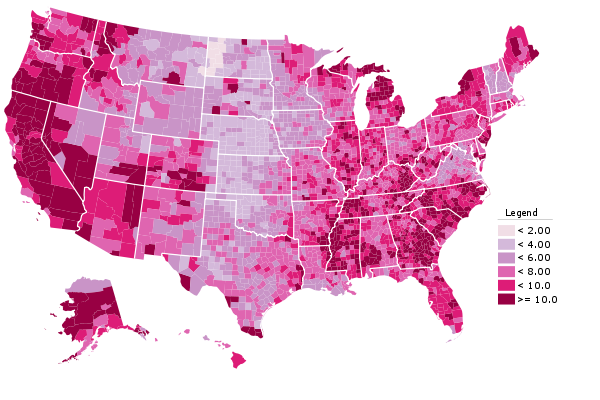
2012 Unemployment Rate by County
To put this in perspective, here’s the corresponding map for 2009:
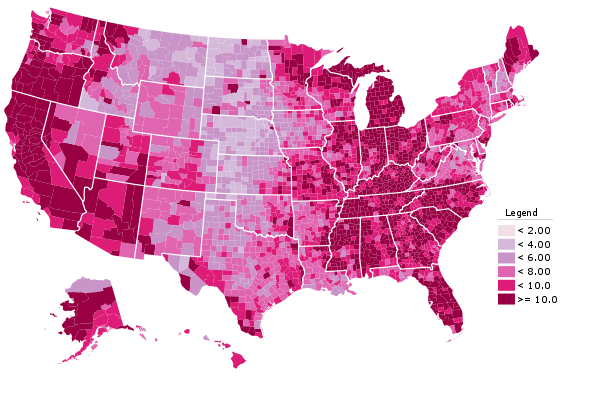
2009 Unemployment Rate by County
It’s interesting to see where there has been improvement versus where there hasn’t, though I stop thresholding at 10% so that if people we well above it but dropped to just merely above it, my maps wouldn’t show that improvement.
Here’s a look at the large metro areas, ranked by total decline in unemployment rate.
| Rank by Total Improvement |
Metro Area |
2011 |
2012 |
Total Change |
| 1 |
Las Vegas-Paradise, NV |
13.5 |
11.2 |
-2.3 |
| 2 |
Orlando-Kissimmee-Sanford, FL |
10.2 |
8.4 |
-1.8 |
| 3 |
Tampa-St. Petersburg-Clearwater, FL |
10.6 |
8.8 |
-1.8 |
| 4 |
Miami-Fort Lauderdale-Pompano Beach, FL |
10.2 |
8.5 |
-1.7 |
| 5 |
Jacksonville, FL |
9.9 |
8.3 |
-1.6 |
| 6 |
Sacramento–Arden-Arcade–Roseville, CA |
11.9 |
10.4 |
-1.5 |
| 7 |
Birmingham-Hoover, AL |
7.9 |
6.4 |
-1.5 |
| 8 |
Cincinnati-Middletown, OH-KY-IN |
8.6 |
7.1 |
-1.5 |
| 9 |
Riverside-San Bernardino-Ontario, CA |
13.6 |
12.1 |
-1.5 |
| 10 |
Nashville-Davidson–Murfreesboro–Franklin, TN |
8.1 |
6.6 |
-1.5 |
| 11 |
Louisville/Jefferson County, KY-IN |
9.7 |
8.3 |
-1.4 |
| 12 |
San Jose-Sunnyvale-Santa Clara, CA |
10.0 |
8.6 |
-1.4 |
| 13 |
Columbus, OH |
7.5 |
6.1 |
-1.4 |
| 14 |
Kansas City, MO-KS |
8.0 |
6.6 |
-1.4 |
| 15 |
Houston-Sugar Land-Baytown, TX |
8.1 |
6.8 |
-1.3 |
| 16 |
Charlotte-Gastonia-Rock Hill, NC-SC |
10.8 |
9.5 |
-1.3 |
| 17 |
Seattle-Tacoma-Bellevue, WA |
8.7 |
7.4 |
-1.3 |
| 18 |
San Francisco-Oakland-Fremont, CA |
9.4 |
8.1 |
-1.3 |
| 19 |
Los Angeles-Long Beach-Santa Ana, CA |
11.4 |
10.1 |
-1.3 |
| 20 |
Salt Lake City, UT |
6.7 |
5.5 |
-1.2 |
| 21 |
Phoenix-Mesa-Glendale, AZ |
8.5 |
7.3 |
-1.2 |
| 22 |
St. Louis, MO-IL |
8.8 |
7.6 |
-1.2 |
| 23 |
Dallas-Fort Worth-Arlington, TX |
7.8 |
6.7 |
-1.1 |
| 24 |
San Diego-Carlsbad-San Marcos, CA |
10.0 |
8.9 |
-1.1 |
| 25 |
Detroit-Warren-Livonia, MI |
11.6 |
10.5 |
-1.1 |
| 26 |
Portland-Vancouver-Hillsboro, OR-WA |
9.3 |
8.2 |
-1.1 |
| 27 |
Atlanta-Sandy Springs-Marietta, GA |
9.8 |
8.8 |
-1.0 |
| 28 |
Austin-Round Rock-San Marcos, TX |
6.8 |
5.8 |
-1.0 |
| 29 |
San Antonio-New Braunfels, TX |
7.5 |
6.5 |
-1.0 |
| 30 |
Memphis, TN-MS-AR |
10.0 |
9.0 |
-1.0 |
| 31 |
Chicago-Joliet-Naperville, IL-IN-WI |
9.8 |
8.9 |
-0.9 |
| 32 |
Minneapolis-St. Paul-Bloomington, MN-WI |
6.3 |
5.5 |
-0.8 |
| 33 |
Raleigh-Cary, NC |
8.5 |
7.7 |
-0.8 |
| 34 |
Providence-Fall River-Warwick, RI-MA – Metro |
11.1 |
10.3 |
-0.8 |
| 35 |
Richmond, VA |
7.1 |
6.4 |
-0.7 |
| 36 |
New Orleans-Metairie-Kenner, LA |
7.2 |
6.5 |
-0.7 |
| 37 |
Cleveland-Elyria-Mentor, OH |
7.8 |
7.1 |
-0.7 |
| 38 |
Oklahoma City, OK |
5.5 |
4.8 |
-0.7 |
| 39 |
Denver-Aurora-Broomfield, CO |
8.6 |
7.9 |
-0.7 |
| 40 |
Hartford-West Hartford-East Hartford, CT – Metro |
9.0 |
8.4 |
-0.6 |
| 41 |
Milwaukee-Waukesha-West Allis, WI |
8.0 |
7.4 |
-0.6 |
| 42 |
Indianapolis-Carmel, IN |
8.4 |
7.8 |
-0.6 |
| 43 |
Baltimore-Towson, MD |
7.7 |
7.2 |
-0.5 |
| 44 |
Virginia Beach-Norfolk-Newport News, VA-NC |
7.1 |
6.6 |
-0.5 |
| 45 |
Boston-Cambridge-Quincy, MA-NH – Metro |
6.6 |
6.1 |
-0.5 |
| 46 |
Washington-Arlington-Alexandria, DC-VA-MD-WV |
6.0 |
5.6 |
-0.4 |
| 47 |
Philadelphia-Camden-Wilmington, PA-NJ-DE-MD |
8.6 |
8.6 |
0.0 |
| 48 |
Pittsburgh, PA |
7.2 |
7.2 |
0.0 |
| 49 |
New York-Northern New Jersey-Long Island, NY-NJ-PA |
8.6 |
8.8 |
0.2 |
| 50 |
Rochester, NY |
7.8 |
8.1 |
0.3 |
| 51 |
Buffalo-Niagara Falls, NY |
8.1 |
8.5 |
0.4 |
|


