
If anyone were to doubt that there really are two Washingtons, that the Seattle metropolitan core (and its playgrounds) are another world from most rural to small city Washington (especially east of the Cascade crest), a look at the maps for the vote on Referendum 71 last November should be persuasive. These are not subtle, marginal differences, but indisputable polarization in what political and cultural researchers may call the modernist-traditional divide.
Referendum 71 passed by a 53 to 47 percent vote, and revealing the power of the King County electorate, which alone provided a margin of 204,000, compared to a statewide margin of 113,000! To overcome the problem of variable size of precincts, and the need to suppress too small numbers, I aggregated precincts to census tracts, which have the added advantage of permitting comparison of electoral results with social and economic data from the census.
Looking at the statewide map, about 85 percent of the territory of the state (95 % in Eastern WA, 70 % in western WA) voted NO. But the strong no vote came from overwhelmingly rural areas and small towns. The only core metropolitan census tracts that voted a majority no were in Richland-Kennewick area, Yakima and Longview. The heart of traditionalist, and arguably, of anti-gay sentiment lies in the farm country of eastern Washington, especially wheat and ranching areas in Adams, Douglas, Garfield, Lincoln, Walla Walla and Whitman counties, but extending also to the rich irrigated farmlands of Grant, Franklin, Benton and Yakima counties. The highest no votes in western Washington were far rural stretches, and most interesting, Lynden, home to many Dutch descendants, members of the conservative Christian Reformed Church. Not surprisingly the census tracts in eastern Washington which supported Referendum 71 were the tracts dominated by Washington State University in Pullman, around Central Washington university in Ellensburg, the mountain resorts tracts in western Okanogan (Mazama, Twisp), and a few tracts in the core of the city of Spokane.
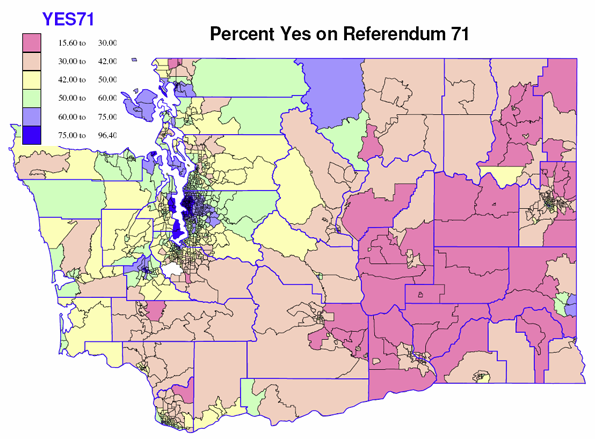
Across western Washington majorities against Ref 71 prevailed over a sizeable contiguous southeastern area, from northern Clark and Skamania through urban as well as rural Lewis county (reinforcing the county’s reputation of being the anti-Seattle!) into much of southeastern Pierce county. A lesser vote against 71 occurred in the rest of rural small town western Washington, including most of rural Snohomish county.
The zone of strong support, voting over 60 percent in favor, flowed largely from Seattle and its inner commuting zone, its spillover playgrounds and retirement areas of Port Townsend and the San Juans, and college and university dominated tracts around Western Washington in Bellingham, the Evergreen State College, Olympia, plus the downtown cores of Vancouver, Tacoma and Everett. Weaker but still supportive were rural spillover, retirement and resort tracts, often in coastal or mountain areas of Pacific, Grays Harbor, Jefferson, Clallam, Skagit and Whatcom counties.
Looking at the detailed map of central Puget Sound, we can see revealing contrasts between the two camps. Support levels of over 75 percent almost coincides with the city of Seattle boundaries (not quite so high in the far south end), and its professional commuting outliers of Bainbridge and Vashon, plus the downtown government core of Olympia and tracts around the University of Puget Sound and the UW Tacoma.
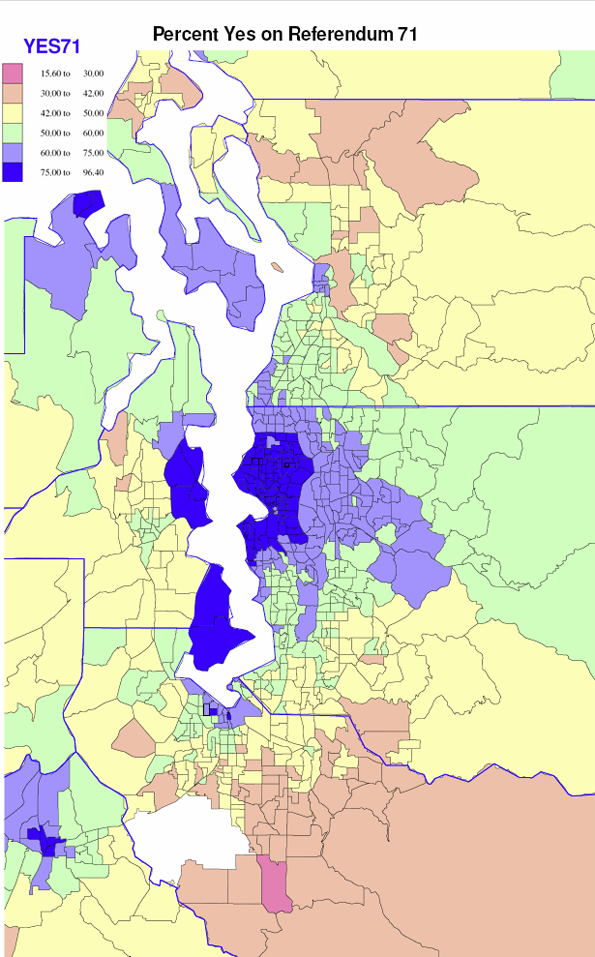
Moderately high support (60 to 75 percent) surrounds the core area of highest support, most dominantly in the more affluent and professional areas north of Seattle through Edmonds and east to Redmond, Issaquah and Sammamish (Microsoft land). Weak but still positive votes occurred in the next tier of tracts, around Olympia, north and west of inner Tacoma, most of urban southwest Snohomish county and much of exurban and rural King county (quite unlike most rural areas). But on the contrary, the shift to opposition is remarkably quick and strong in southeastern King and especially in Pierce county, in northern and eastern Snohomish county, and, not surprisingly, in military dominated parts of Kitsap county (e.g., Bangor) and Pierce (Fort Lewis).
The temptation to compare the voting levels of census tracts with social and economic conditions of those tracts is too great to resist. Here are the strongest correlations (statewide).
| Washington State Correlations with voting in favor of Ref 71 | ||||
| % Use transit | 0.75 | % Drive SOV | -0.54 | |
| % Non-family HH | 0.65 | % HW families | -0.45 | |
| % Single | 0.48 | Average HH size | -0.53 | |
| % Same sex HH | 0.57 | |||
| % aged 20—39 | 0.43 | % under 20 | -0.55 | |
| % foreign born | 0.28 | % Born in Wash. | -0.4 | |
| % College grad | 0.65 | % HS only | -0.62 | |
| % Black | 0.27 | % white | -0.13 | |
| % Asian | 0.42 | % Hispanic | -0.22 | |
| Manager-Profess | 0.53 | % Craft occup | -0.46 | |
| % in FIRE | 0.34 | % laboring occup | -0.47 | |
These statistics reflect the profound Red-Blue division of the American electorate, in both the geographic differences (large metropolitan versus rural and small town), as well as the modern versus traditional dimension (socially liberal or conservative). The strongest single variable is not behavioral, but transit use is a surrogate for the metropolitan/non-metropolitan split. The critical social characteristic lies in the nature of households: the traditional family versus non-families (partners, roommates, singles). This is a powerful tendency, and useful to describe differences in areas, but of course many in families – often more educated and professional – support Ref 71, and many singles – often elderly, or opposite sex partners – opposed it, especially in more conservative parts of the state.
The next strongest set of variables, clearly visual from the maps, lay in the strong split of the electorate according to the predominant educational level of the tracts. The tendency of the more educated to support 71 represents the key statistic of the “modern” vs “Traditional” dimension, and is closely related to the differences by occupation and industry. Managers and professionals, and those working in finance, and information sectors tended to be supportive of 71, while those in laboring and craft occupations, and in manufacturing, transport and utilities, tended to oppose. (South King county and much of Pierce county have high shares of blue collar jobs).
Finally differences by race exist, but are not so strong as, say, in the presidential election in 2008 (although the correlation of the percent for Ref 71 and for Obama was .90).
Yes, greater Seattle is indeed very different than the rest of Washington and much of America as well.
Richard Morrill is Professor Emeritus of Geography and Environmental Studies, University of Washington. His research interests include: political geography (voting behavior, redistricting, local governance), population/demography/settlement/migration, urban geography and planning, urban transportation (i.e., old fashioned generalist).


A great article
I love these articles that have lots of DATA.
Dave Barnes
+1.303.744.9024
http://www.MarketingTactics.com