
Inrix, an industry provider of traffic information, has just published its third annual Traffic Scorecard, which ranks the nation’s 100 largest metropolitan areas based upon the intensity of their peak hour traffic congestion in 2009. The results provide further evidence of the association between higher urban population densities and more intense traffic congestion.
Los Angeles, Again: Not surprisingly, Los Angeles is again the most congested metropolitan area over 1,000,000 population. In Los Angeles, roadway travel takes nearly 34.7% more in peak periods than when there is no congestion. This means that a trip that would take 30 minutes without congestion would take, on average 40.5 minutes during peak periods.
The principal measure used by Inrix is the Travel Time Index, which was developed by the Texas Transportation Institute (TTI), for its congestion reports that started in 1982. TTI’s latest Urban Mobility Report is for 2007. The Inrix measures are developed from actual GPS vehicle readings. This information is also provided to TTI to assist in preparation of its annual Urban Mobility Report.
Measuring Delay: In the new edition, Inrix switches from using the Travel Time Index to what it calls the Travel Time Tax. The difference between the two measures is that the Travel Time Tax measures the percentage of delay, such as 35% in Los Angeles, while the Travel Time Index would state the figure as 1.35. The new method is preferable because differences in traffic congestion are more readily apparent. . For example, a metropolitan area having a Travel Time Tax of 15% would have 50% worse traffic congestion than a metropolitan area having a Travel Time Tax of 10%. This large difference is not as obvious when comparing the Travel Time Index values of 1.15 and 1.10. The “Travel Time Tax” parlance, however, is less than optimal and this article will use “average congestion delay” instead.
Ranking the Metropolitan Areas: The average congestion delay in Los Angeles was much worse than in the other largest metropolitan areas, just as its core urban area density is well above that of anywhere else in the US, including New York (where far less dense suburbs more than negate the density advantage in the core city). It also doesn’t help that a number of planned freeways were cancelled in Los Angeles over the last 50 years.
Among the large metropolitan areas, Washington, DC had the second worst Average congestion delay, at 22.4%, followed by San Francisco, at 21.5%, Austin at 20.7% and New York at 19.7%. Austin may seem to have placed surprisingly high, however this was the nation’s last large metropolitan area to open a full freeway to freeway interchange and has only recently begun to develop a comprehensive freeway system, through the addition of toll roads. Austin’s late roadway development is the result of two factors. Austin was too small in 1956 to receive a beltway under the interstate highway system and an anti-freeway movement delayed construction for decades.
Inrix also develops an average congestion delay for the worst commuting hour. Los Angeles also has the most congested worst hour, with an average congestion delay of 69%. Austin ranked second worst at 55%, while San Francisco was third at 46%, Washington, DC fourth at 45% and New York fifth at 44%.
Honolulu: Almost as Bad as Los Angeles: Smaller metropolitan areas also exhibited intense traffic congestion. Honolulu had an average congestion delay nearly as bad as Los Angeles, at 32.4% and a worst hour average congestion delay of 64%. The core urban area of Honolulu has the highest density of any metropolitan area between 500,000 and 1,000,000 population. New York exurb Bridgeport-Stamford had a worst hour average congestion delay of 63%, with a peak period average congestion delay of 18.0%.
Inrix: Density and Traffic Congestion: Virtually all of the congestion and most of the analyzed road mileage is in the urban areas, rather than in the rural areas that make up the balance of the metropolitan areas. The metropolitan areas with more dense urban areas tend to have worse traffic congestion, as the table below indicates.
• Metropolitan areas with core urban densities (see Note 1) of more than 4,000 per square mile had peak period average congestion delays of 18.4%, which is more than three times that of metropolitan areas with core urban densities of less than 2,000 (5.9%).
• Metropolitan areas with core urban densities of more than 4,000 per square mile had worst peak hour average congestion delays of 37.5%, which is nearly 2.4 times that of metropolitan areas with core urban densities of less than 2,000 (15.9%).
These relationships are similar to those indicated in the Texas Transportation Institute data for 2007.
| Traffic Congestion & Urban Density in the United States: 2009 | ||||
| Core Urban Area Density (2000) | Peak Period Average Congestion Delay: 2009 | Compared to Least Dense Category | Worst Hour Average Congestion Delay: 2009 | Compared to Least Dense Category |
| Over 4,000 | 18.4% | 3.26 | 37.5% | 2.36 |
| 3,000-3,999 | 10.0% | 1.76 | 22.3% | 1.41 |
| 2,000-2,999 | 7.3% | 1.30 | 17.7% | 1.12 |
| Under 2,000 | 5.6% | 1.00 | 15.9% | 1.00 |
| Density: Population per square mile | ||||
| Travel Time Tax: Additional travel time required due to traffic congestion | ||||
| 2000 population density is the latest reliable data | ||||
| Calculated from INRIX & 2000 Census data | ||||
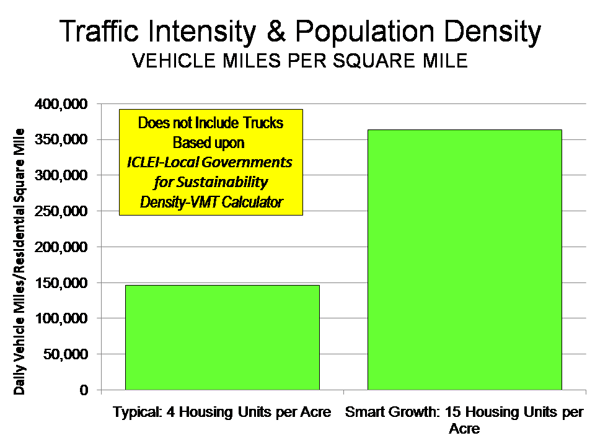
Sierra Club Data Also Shows Nexus: Moreover, the association between higher densities and greater traffic congestion is indicated by the ICLEI-Local Governments for Sustainability Density-VMT Calculator, which is based upon Sierra Club research. According to the Calculator, under the “smart growth” scenario, residential housing would be 15 units per acre, as opposed to its “business as usual” scenario at a typical density of four housing units per acre. The density of traffic (vehicle miles per square mile) under the higher density “smart growth” strategy would be 2.5 times as high as under the “business as usual” scenario (Figure).
The Inevitable Comparisons: Invariably, analysts (smart growth advocates and me) like to point out relationships between Portland, with its “smart growth” policies and Atlanta, the least dense major urban area in the world. The Inrix data shows Portland to have an average peak hour delay of 12.2%, which is 15% worse than Atlanta (10.6%). Portland is nearly twice as dense as Atlanta, while Atlanta’s traffic congestion is made worse by one of the most decrepit freeway and arterial systems in the nation.
A National Vision: Inrix has also developed a monthly national congestion delay factor. Inrix notes that traffic congestion had been improving as driving declined due to the Great Recession. However, Inrix refers to reduction in driving as “lucky,” and notes that without a “national vision” that “includes addressing congestion as a national priority,” greater traffic congestion will result.
There is indeed good reason to address traffic congestion. As David Hartgen and M. David Fields have shown, there is a strong relationship between the higher levels of mobility that occur with less congestion and greater economic growth. Obviously that relationship extends to higher urban densities, which are associated with economically counter-productive levels of traffic congestion.
But there is more than jobs and the economy. More intense traffic congestion produces more intense air pollution as well as more greenhouse gas emissions. It is well to remember that public health was the rationale for air pollution regulation. Air pollution’s negative impacts are so local that they are measured in the quality of life of individual people, especially those in close proximity to unnecessarily overcrowded roads. It is ironic that the higher density promoted by smart growth advocates exposes urban residents to more intense air pollution.
Note 1: 2000 core urban area (urbanized area) population densities are used in this analysis because there is no later reliable information. The next reliable urban area density data will be a product of the 2010 census. The Federal Highway Administration (FHWA) produces later urban area density figures, many of which are substantially inconsistent with those of the United States Bureau of the Census, which is the primary source of such information. For example, as late as 2005, FHWA reported the Houston urban area to have 1.3 million fewer people than the Bureau of the Census, while reporting a land area nearly 250 square miles larger than the census had measured. Of course, this is a physical impossibility. The result was that Houston’s density was overstated by 45%.
Note 2: Inrix also ranks metropolitan areas using an “overall congestion” measure, which is simply all congestion added up. As a result, the overall congestion measure is heavily weighted by population. This is illustrated by comparing Los Angeles and Honolulu. These metropolitan areas have very similar average congestion delays, as noted above. This means that drivers encounter similar traffic delays during peak in Los Angeles and Honolulu. However, Honolulu’s overall congestion measure is 95% less than that of Los Angeles, principally driven by the fact that Honolulu’s population is 93% less. As such, the overall congestion measure is of little relevance to people in their day to day commute or as a comparative measure of the intensity of congestion between areas.
Photograph: Los Angeles City Hall.
Wendell Cox is a Visiting Professor, Conservatoire National des Arts et Metiers, Paris. He was born in Los Angeles and was appointed to three terms on the Los Angeles County Transportation Commission by Mayor Tom Bradley. He is the author of "War on the Dream: How Anti-Sprawl Policy Threatens the Quality of Life.”


