
On schedule, the annual ritual occurred last week in which the Census Bureau releases population and migration estimates and the press announces that people are no longer moving to the Sun Belt. The coverage by The Wall Street Journal was typical of the media bias, with a headline “Sun Belt Loses its Shine.” In fact, the story is more complicated – and more revealing about future trends.
Domestic Migration Tracks Housing Affordability: There have been changes in domestic migration (people moving from one part of the country to another) trends in the last few years, but the principal association is with housing affordability.
Severe and Not-Severe Bubble Markets: Overall, the major metropolitan markets with severe housing bubbles (a Median Multiple rising to at least 4.5, see note) lost nearly 3.2 million domestic migrants (all of these markets have restrictive land use regulation, such as smart growth or growth management) from 2000 to 2009. However, not all markets with severe housing bubbles lost domestic migrants. “Safety valve” bubble markets drew migration from the extreme bubble markets of coastal California, Miami and the Northeast. These “safety valve” markets (including Phoenix, Las Vegas, Portland, Seattle, Riverside-San Bernardino, Orlando, Tucson and Tampa-St. Petersburg), gained a net 2.2 million from 2000 to 2009, while the other bubble markets lost 5.3 million domestic migrants from 2000 to 2009 (See Table below, metropolitan area details in Demographia US Metropolitan Areas Table 8). At the same time, the markets that did not experience a severe housing bubble (those in which the Median Multiple did not reach 4.5) gained a net 1.5 million domestic migrants.
The burst of the housing bubble explains the changes in domestic migration trends. Housing affordability has improved markedly in the extreme bubble markets, so that there was less incentive to move. Then there was the housing bust-induced Great Recession, which also slowed migration since people had more trouble selling their homes or finding anew job. As a result, the migration to the “safety valve” markets and to the smaller markets dropped substantially.
- During 2009, the “safety valve” markets gained only 51,000 net domestic migrants, one-fifth of the annual average from 2000 to 2008.
- At the same time, the other severe housing bubble markets lost 236,000 domestic migrants in 2009, compared to the average loss of 638,000 from 2000 to 2008.
- Areas outside the major metropolitan areas also experienced a significant drop in domestic migration, dropping from an annual average of 203,000 between 2000 and 2008 to 23,000 in 2009.
- The major metropolitan markets that did not experience a severe housing bubble gained 161,000 domestic migrants in 2009, little changed from the 169,000 average from 2000 to 2008. These markets are concentrated in the South and Midwest. Indianapolis, Kansas City, Nashville, Louisville and Columbus as well as the Texas metropolitan areas continued their positive migration trends.
| Domestic Migration by Severity of the Housing Bubble | |||
| Metropolitan Areas over 1,000,000 Population | |||
| 2000-2008 | |||
| Metropolitan Areas | 2000-2009 | 2009 | 2000-2008 Average |
| Withouth Severe Housing Bubbles | 1,509,870 | 160,514 | 168,670 |
| With Severe Housing Bubbles | (3,161,514) | (184,486) | (372,129) |
| Not "Safety Valve" Markets | (5,347,211) | (235,838) | (638,922) |
| "Safety Valve" Markets | 2,185,697 | 51,352 | 266,793 |
| Outside Largest Metropolitan Areas | 1,651,644 | 23,972 | 203,459 |
| Severe housing bubbles: Housing costs rose to a Median Multiple of 4.5 or more (50% above the historic norm of 3.0). | |||
| Median Multiple: Median House Price/Median Household Income | |||
| "Safety Valve" refers to markets with severe housing bubbles that received substantial migration from more expensive markets (coastal California, Miami and the Northeast). These markets include Las Vegas, Phoenix, Riverside-San Bernardino, Sacramento, Portland, Seattle, Orlando, Tucson and Tampa-St. Petersburg. | |||
Moreover, the Census Bureau revised its previous domestic migration figures for 2000 to 2008 to add more than 110,000 from the markets without severe housing bubbles, while taking away more than 150,000 domestic migrants from the markets with severe housing bubbles. This adjustment alone rivals the 2009 domestic migration loss of 183,000 in these markets
Population Growth: The Top 10 Metropolitan Areas: Sun Belt metropolitan areas continued to experience the greatest population growth. Between 2000 and 2009, the fastest growing metropolitan areas were Atlanta, Dallas-Fort Worth and Houston, In 2009, Washington, DC was added to the list (Details in Demographia US Metropolitan Areas, Table 2).
New York: The New York metropolitan area remains the nation’s largest, now reaching a population of over 19 million. More than 700,000 new residents have been added since 2000. However, New York’s population growth has been the second slowest of the 10 largest metropolitan areas since 2000 (Figure 1). Moreover, New York’s net domestic out-migration has been huge. New York has lost 1,960,000 domestic migrants, which is more people than live in the boroughs of The Bronx and Richmond combined. Overall, 10.7% of the New York metropolitan area’s 2000 population left the metropolitan area between 2000 and 2009. More than 1,200,000 of this domestic migration was from the city of New York. Between 2008 and 2009, New York’s net domestic out-migration slowed from the minus 1.32% 2000-2008 annual rate to minus 0.58%., reflecting the smaller migration figures that have been typical of the Great Recession.
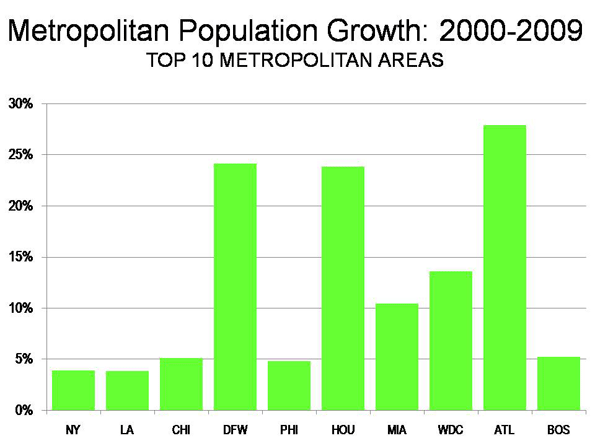
Los Angeles: For decades, Los Angeles has been one of the world’s fastest growing metropolitan areas. Growth had ebbed somewhat by the 1990s, when Los Angeles added 1.1 million people. The California Department of Finance had projected that Los Angeles would add another 1.35 million people between 2000 and 2010. Yet, the Los Angeles growth rate fell drastically. From 2000 to 2009, Los Angeles added barely one-third the projected amount (476,000) and grew only 3.8%. Unbelievably, fast growing Los Angeles became the slowest growing metropolitan area among the 10 largest. In 2009, Los Angeles had 12.9 million people. Los Angeles lost 1.365 million domestic migrants, which is of 11.0% of its 2000 population, and the most severe outmigration among the top 10 metropolitan areas (Figure 2).
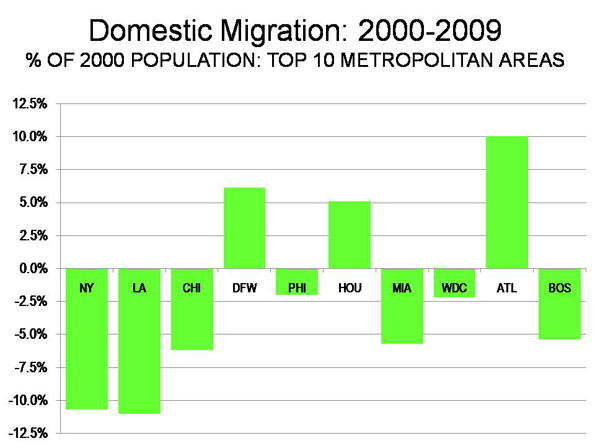
Chicago: Chicago continues to be the nation’s third largest metropolitan area, at 9.6 million population, a position it has held since being displaced by Los Angeles in 1960. Chicago has experienced decades of slow growth and continues to grow less than the national average, at 5.1% between 2000 and 2009 (the national average was 8.8%). Yet, Chicago grew faster than both New York and Los Angeles. Chicago also lost a large number of domestic migrants (561,000), though at a much lower rate than New York and Chicago (6.2%). Even so, Chicago is growing fast enough that it could exceed 10 million population in little more than a decade, by the 2020 census.
Dallas-Fort Worth: Dallas-Fort Worth has emerged as the nation’s fourth largest metropolitan area, at 6.4 million, having added 1,250,000 since 2000. In 2000, Dallas-Fort Worth ranked fifth, with 500,000 fewer people than Philadelphia, which it now leads by nearly 500,000. Dallas-Fort Worth added more population than any metropolitan area in the nation between 2008 and 2009 and has been the fastest growing of the 10 top metropolitan areas since 2006. As a result, Dallas-Fort Worth has replaced Atlanta as the high-income world’s fastest growing metropolitan area with more than 5,000,000 population. Dallas-Fort Worth added a net 317,000 domestic migrants between 2000 and 2009.
Philadelphia: Philadelphia is the nation’s fifth largest metropolitan area, at just below 6,000,000 population. Like Chicago, Philadelphia has had decades of slow growth, yet has grown faster in this decade than both New York and Los Angeles (4.8%). Philadelphia has lost a net 115,000 domestic migrants since 2000, for a loss rate of 2.2%, well below that of New York, Los Angeles and Chicago.
Houston: Houston ranks sixth, with 5.9 million people and is giving Dallas-Fort Worth a “run for its money.” Like Dallas-Fort Worth, Houston has added more than 1,000,000 people since 2000. Over the same period, Houston has passed Miami and Washington (DC) in population. Houston has added a net 244,000 domestic migrants since 2000, and added 50,000 in 2008-2009, the largest number in the country. Like Dallas-Fort Worth, Houston accelerated its annual domestic migration growth rate in 2008-2009. At the current growth rate, Houston seems likely to pass Philadelphia in population shortly after the 2010 census.
Miami: Miami (stretching from Miami through Fort Lauderdale to West Palm Beach) is the seventh largest metropolitan area, with 5.6 million people. Miami has added more than 500,000 people, for a growth rate of 10.4%. However, Miami has suffered substantial domestic migration losses, at 287,000, a loss rate of, 5.7% relative to its 2000 population.
Washington (DC): Washington recaptured 8th place, moving ahead of Atlanta, which had temporarily replaced it. Washington’s population is 5.5 million and added 655,000 between 2000 and 2009, for a growth rate of 13.6%. However, Washington lost a net 110,000 domestic migrants, 2.2% of its 2000 population. That trend was reversed in 2008-2009, when a net 18,000 domestic migrants moved to Washington, perhaps reflecting the increased concentration of economic power in the nation’s capital.
Atlanta: Atlanta is the real surprise this year. For more than 30 years, Atlanta has had strong growth, however, this year it slowed. Atlanta is the 9th largest metropolitan area in the nation, at 5.5 million. Since 2000, Atlanta has added 1.2 million people, though added only 90,000 last year. Atlanta has added a net 429,000 domestic migrants since 2000, though the rate slowed to only 17,000 in 2008-2009.
Boston: Boston is the nation’s 10th largest metropolitan area, with 4.6 million people. During the 2000s, Boston has added nearly 200,000, growing by 4.2%. Yet, Boston has also experienced a net domestic migration loss of 236,000, or 5.4% of its 2000 population. In 2008-2009, Boston, like Washington, reversed its domestic migration losses, adding 7,000.
Trends by Size of Metropolitan Area: As throughout the decade, the slowest growing areas of the nation have been metropolitan areas over 10,000,000 population (New York and Los Angeles), which grew 3.9% and non-metropolitan areas, which grew 2.6% during the decade Metropolitan areas that had between 2.5 and 5.0 million population in 2000 boasted the biggest jump (these include fast growing Houston and Atlanta, which are now more than 5 million), at 13.4% for the decade. All of the other size classifications grew between 8.9% and 11.3% over the decade (see Demographia US Metropolitan Areas, Table 1). Metropolitan areas that began the decade with between 5,000,000 and 10,000,000 population gained 10.0%. Those with 250,000 to 500,000 grew 10.4%, those with 500,000 to 1,000,000 grew 10.2% and the smallest metropolitan areas, those from 50,000 to 250,000 grew 8.9%
Metropolitan areas over 1,000,000 population lost 2.19 million domestic migrants during the decade, but smaller metropolitan areas added 2.24 million domestic migrants. Non-metropolitan areas lost 50,000 domestic migrants. In 2009, the smaller metropolitan areas gained 125,000 domestic migrants, while the larger metropolitan areas lost 30,000. Non-metropolitan areas lost more than 90,000 domestic migrants. As noted above, these smaller figures for 2009 reflect the more stable housing market and the extent to which the Great Recession has reduced geographic mobility (See Demographia US Metropolitan Areas, Tables 1 and 3).
Note: The Median Multiple is the median house price divided by the median household income. The historic standard has been 3.0.
Photograph: Dallas
Wendell Cox is a Visiting Professor, Conservatoire National des Arts et Metiers, Paris. He was born in Los Angeles and was appointed to three terms on the Los Angeles County Transportation Commission by Mayor Tom Bradley. He is the author of "War on the Dream: How Anti-Sprawl Policy Threatens the Quality of Life.”


