
The Center for Neighborhood Technology (CNT) has produced a housing and transportation index (the "H&T Index"), something that has been advocated by Secretary of Housing and Urban Development (HUD) Shaun Donovan and Secretary of Transportation Ray LaHood. The concept is certainly worth support. Affordable housing and mobility are crucial to the well-being of everyone, which translates into a better quality of life, more jobs and economic growth. Surely, much of the internationally comparatively high standard of living enjoyed by so many middle and lower income households in the United States has resulted from inexpensive housing (often on the urban fringe) and the ability to access virtually all of the urban area by quick and affordable personal transportation.
CNT has developed an impressive website, with "tons" of data and maps that are both impressive and attractive. Maps can be adjusted to look at approximately 40 demographic indictors for "block groups" in the nation's metropolitan areas. Block groups are neighborhoods (smaller than census tracts) defined by the Bureau of the Census and have an average population of approximately 1,500.
CNT uses the HUD "housing burden" at 30% of household income as a maximum for affordability and further says that housing and transportation should not exceed 45%. The maps show neighborhoods that CNT finds to be affordable and not affordable by these criteria.
But for all of its superficial impressiveness, the H&T Index is subject to serious misinterpretation and suffers from methodological flaws that neutralize the usefulness of its affordability indices.
The H&T Index: Potential for Misinterpretation
The H&T Index: Not a Neighborhood Index: The H&T Index is particularly susceptible to misinterpretation by ideological interests contemptuous of America's suburban lifestyle, who would use public policy to force people to live in higher densities. While the H&T Index reports data at the neighborhood level, it is not a neighborhood index. However, the H&T Index does not compare neighborhood housing and transportation costs with neighborhood incomes. Rather, the H&T Index uses the metropolitan median household income.
As a result, low income neighborhoods appear to be affordable, because their less costly housing is compared to the higher metropolitan area median income. Higher income neighborhoods appear unaffordable, because their higher housing costs are compared to the lower metropolitan area median income.
Press reports, such as in the Washington Post have failed to clearly describe this issue. Without clear reporting, the H&T Index is could play into the popular fiction that suburbs are filled with households unable to cannot afford their housing and transportation. In fact, the vast majority of suburban homeowners can afford their transportation and housing and an appropriate portrayal of neighborhood data (with the corrections noted below) would illustrate this. The high level of recent foreclosures that have occurred in some suburbs are simply a reflection of the fact that "easy money" enticed some people to take on obligations that were beyond their means (just as central city developers built condominium towers that have been foreclosed upon or offered as rentals, with unit prices discounted 50% and more).
The potential for misinterpretation is illustrated by examining three neighborhoods in Dallas County (Table 1), one low income, one middle income and one high income (2000 data).
- The H&T Index indicates that housing costs are 8% of incomes in the low-income West Dallas neighborhood when compared to median metropolitan income. However, when the neighborhood income is used, the share of income required for housing is 57%, nearly twice the HUD maximum standard.
It might be thought that people should move to West Dallas from the suburbs to take advantage of the low housing prices. However, any such migration would quickly escalate land prices up to eliminate any advantage (and to force the low income residents to move, as happens in "gentrifying" neighborhoods).
- In the middle income (Garland) neighborhood, housing costs as a share of income are 24%, whether measured by the metropolitan or neighborhood income, both within the HUD 30% maximum
- In the high income (University Park) neighborhood, CNT finds housing costs to be 102% of median metropolitan incomes. When neighborhood income is used instead, housing costs drop to 25% of incomes, well within the HUD 30% maximum.
| Metropolitan & Neighborhood Housing & Transportation Indices: 2000 | |||
| Factor | Low Income Neighborhood: West Dallas | Middle Income Neighborhood: Garland | High Income Neighborhood: University Park |
| Median Household Income: Metropolitan (PMSA) | $48,364 | $48,364 | $48,364 |
| Housing Cost Share | 8% | 24% | 102% |
| Median Household Income: Neighborhood | $6,989 | $48,594 | $200,001 |
| Housing Cost Share | 57% | 24% | 25% |
| Base data from H&T Index | |||
The H&T Index: Criticisms of the Methodology
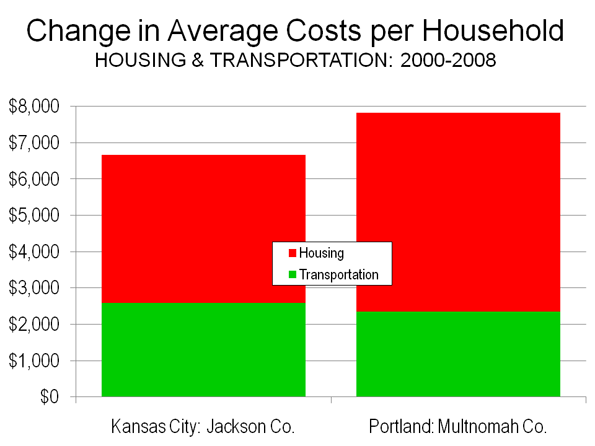
(1) Missing the Housing Bubble? CNT places more emphasis on transportation costs than on housing costs. This is evident in the H&T Index attention to rising transportation costs from 2000 to 2008. The housing bubble and its impact on household costs appears nowhere among the 40 indicators (Note).
Yet, there is every indication that housing costs have risen substantially more than transportation costs since 2000. For example, in Kansas City's core Jackson County, the Census Bureau's American Community Survey data indicates that the increase in average housing costs was nearly 60% greater than CNT's transportation cost increase. In Portland's core Multnomah County, the increase in average housing costs was more 125% greater than CNT's estimated increase in transportation costs (Figure).
(2) Exaggerating by Mixing Averages and Medians: The H&T Index compares average housing and transportation costs with the median household income. Averages and means are not the same things. Median income data is "middle" score, with one half of households having incomes above the median and one-half having incomes below the median. On the other hand, "average" housing costs and transportation costs are the total housing and transportation costs divided by the total number of households. High incomes and high priced housing skews averages up. Mixing medians and averages is inherently invalid. For example, in 2008, average housing costs were 19% higher than median housing costs. This means that, on average, where the H&T Index reports a 30% housing affordability figure, it is really substantially lower, at 25% (30% reduced by 19%).
Thus, the net effect of comparing average housing costs to median incomes makes the housing element of the H&T Index worse than it really is.
(3) Exaggerating by Leaving Some Households Out: The H&T Index excludes home owning households without a mortgage. The average housing expenditures of households without mortgages are smaller than those of households with mortgages. However, this is a material omission, since housing costs include utility payments. In Multnomah County, excluding households without mortgages raises average housing expenditures by nearly 10% (in 2008). Households without mortgages are households too. The net effect of excluding households without mortgages is to increase housing costs, making the housing portion of the index higher than it would otherwise be.
(4) Exaggerating by Mixing Data from Different Years: The H&T Index provides 2008 estimates for neighborhood transportation costs, using modeled data. Transportation costs have surely increased since 2000, reaching their peak in 2008 due to the highest ever gasoline prices. CNT again compares these average costs to median household income, but not for 2008. CNT uses 2000 income data. In Jackson County and Multnomah counties, the use of 2000 instead of 2008 data exaggerates transportation's share of household income between 20% and 25%.
Each of the above methodological issues is sufficient to render H&T Index outputs to be unreliable.
Housing's Role in Housing & Transportation Affordability
While both transportation and housing costs are important, housing costs have dented household budgets far more than the increase in transportation costs. Even after the house price declines of the last few years, house prices remain well above their historic ratio to household incomes. This will only get worse, if, as many expect, mortgage interest rates rise from their present lows and as rents rise to follow higher house prices.
In contrast, transportation costs are more susceptible to reduction than housing costs. Once the mortgage is signed, the cost of the house will not be reduced. Once the lease is signed, there is little chance that the rent will be lowered. But transportation costs will be reduced in the future by the far more fuel efficient vehicles being required by Washington. Some people can work at home part of the time. People also change cars more frequently than they change houses. If costs become an issue, perhaps the next car is a compact rather than an SUV.
CNT's focus on trends in transportation costs rather than housing costs is consistent with its related study, Penny Wise Pound Fuelish, which advocates expansion of prescriptive land use (smart growth) policies to encourage core urban development and make much suburban development illegal. Yet, these very policies played a dominant role in driving house prices up three times as fast relative to incomes as in metropolitan areas that did not adopt them.
Genuine advocacy for affordability requires addressing both transportation and housing costs. It also requires recognition of the significant damage done to affordability by prescriptive land use policies. An extra dollar that a household must pay for housing is just as valuable as one spent on transportation.
All of which leaves us where we started. The nation could still use a reliable housing and transportation index.
Note: CNT provides no 2008 data for housing costs. Such costs will not be available at the neighborhood level from the American Community Survey until 2012 or 2013. However, it would likely have been no more difficult for CNT to model updated housing data by neighborhood than it was to model 2008 data for transportation costs at the neighborhood level.
Wendell Cox is a Visiting Professor, Conservatoire National des Arts et Metiers, Paris. He was born in Los Angeles and was appointed to three terms on the Los Angeles County Transportation Commission by Mayor Tom Bradley. He is the author of "War on the Dream: How Anti-Sprawl Policy Threatens the Quality of Life.”
Photograph: Hartford Suburbs


The Center for Neighborhood
The Center for Neighborhood Technology (CNT) has produced a housing and transportation index (the "H&T Index"), something that has Denpa Kyoushi manga been advocated by Secretary of Housing and Urban Development (HUD) Shaun Donovan and Secretary of Transportation Ray LaHood. The concept is certainly worth support. Affordable housing and mobility are crucial to the well-being of everyone, which watch Aikatsu! online translates into a better quality of life, more jobs and economic growth. Surely, much of the internationally comparativ
_Visit: tu van dau tu nuoc
_Visit: tu van dau tu nuoc ngoai, cong bo thuc pham, thiet ke website ban hang, thanh lap cong ty, dang ky nhan hieu, cong bo luu hanh my pham...
The Center for Neighborhood
The Center for Neighborhood Technology Onepunch-Man (CNT) has produced a housing and transportation index (the "H&T Index"), something that has been advocated by Secretary of Housing and Urban Development (HUD) Shaun Donovan and Secretary of Transportation Ray LaHood. The concept is certainly worth Naruto: Shippuuden anime watch support. Affordable housing and mobility are crucial to the well-being of everyone, which translates into a better quality of life, more jobs and economic growth. Surely, much of the internationally comparativ
Transportation
The transportation is a very important aspect, I worked for several years in a container transportation Turkey company and I have a good idea about this theme. I hope the authorities will come with a good plan.
This is indeed a great news.
Indeed good news!
Interesting observations.
I live in a fairly affluent East Bay neighborhood in the SF Bay Area. We've been renting there for 6 years so far. This city has a required mandate for affordable housing yet it- just like many other Bay Area cities- fail to come close to ever meeting those requirements. There is what I call a severe "Not in my backyard" mentality that is cleverly concealed via arguments that adding more homes would "ruin the quality of life" for existing residents... whom then proceed to have children that I assume will one day grow up and want to live close to Mom and Dad yet won't be able to since no new houses are allowed apparently.
This attitude has more to do with socioeconomic profiling than anything because even though there has been fierce opposition to lower income housing a whole new neighborhood filled with $700,000-$1.5 million dollar Mcmansions was built several years ago. The way that the development met the requirements was by having "Below market" houses within the development. What qualified as below market? The $700,000 houses.
Across the way in West Oakland during the boom, some of the small houses in unquestionably crime-ridden neighborhoods were selling for $550,000. Well above the area median... which doesn't mean much since the Bay Area has always had home prices off the ritcher scale in regards to actual incomes. Yet the prices in these neighborhoods were ridiculous. They have since fallen back down to $150,000 or so prices, which in all honesty is still well above what the area's median income could ever hope to afford.
I would bet that the majority of America's most upscale cities do a miserable job of providing more affordable housing for its less wealthy residents. I grew up in a fairly poor, rural area in the South and my experiences living in wealthy cities on both coasts tends to be that the wealthier the neighborhood, the more resistance there is towards helping lower income residents.