
International travelers and expatriates have long known that currency exchange rates are not reliable indicators of purchasing power. For example, a traveler to France or Germany will notice that the dollar equivalent in Euros cannot buy as much as at home. Conversely, the traveler to China will note that the dollar equivalent in Yuan will buy more.
Economists have attempted to solve this problem by developing "purchasing power parities," which are used to estimate currency conversion rates that equalize values based upon prices (Note 1). This helps establish the real value of money in a particular place.
When people move from one region of the United States to another they can encounter a similar phenomenon. For example, a dollar is not worth as much in San Jose as it is in St. Louis. Research by the US Department of Commerce Bureau of Economic Analysis (BEA), for example, found that in 2006 a dollar purchased roughly 35 cents less in San Jose than in St. Louis. BEA researchers estimated "regional price parities" for states and the District of Columbia and for all of the nation's metropolitan areas (Note 2). Regional price parities can be thought of as the equivalent of regional (state or metropolitan area) exchange rates. This research was covered in previous newgeography.com articles by Eamon Moynihan and this author.
This article uses Department of Labor, Bureau of Labor Statistics metropolitan area consumer price indexes to estimate the 2009 cost of living and per capita personal income adjusted for the cost of living.
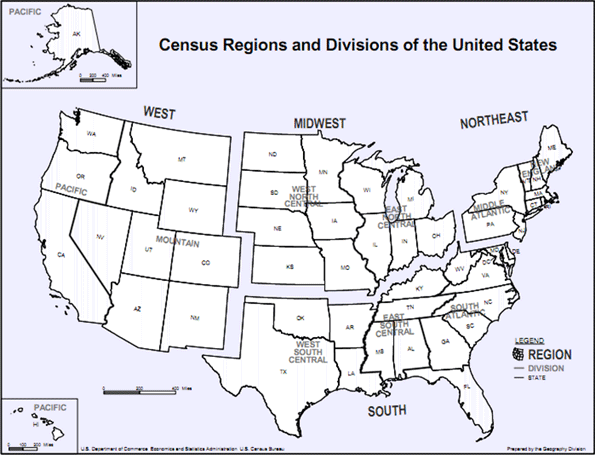
Cost of Living: At the regional level (See Census Region Map, Figure 1), there are substantial differences in the cost of living (Figure 2). The lowest cost of living is in the Midwest, at 4.8 percent below the nation. The South has the second lowest cost of living at 3.9 percent above the national level. The West is the most expensive area, 13.5 percent above the national cost-of-living, while the Northeast’s cost-of-living stands 11.3 percent above the national rate.
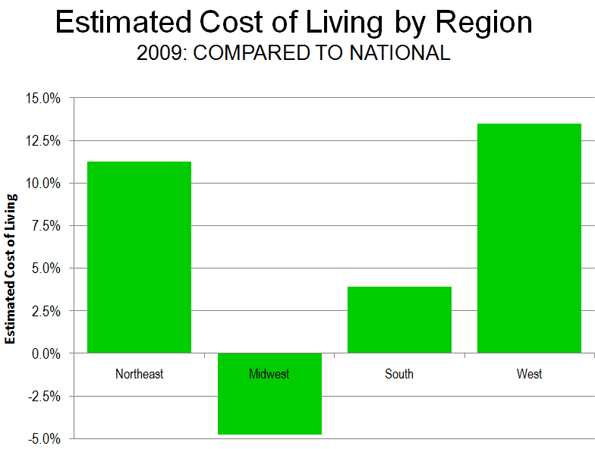
The cost of living in the South may seem higher than expected. But if the higher cost metropolitan areas of Washington, Baltimore and Miami are excluded, the cost of living in the South falls to 1.5 percent below the national rate. If the California metropolitan areas are excluded from the West, the cost of living still remains 4.0 percent above the national rate.
Per Capita Income: The highest unadjusted per capita incomes are in the Northeast, followed by the West, the South and the Midwest. Yet when metropolitan area exchange rates are taken into consideration, the order changes significantly. The Northeast remains the most affluent, and the Midwest moves from last place to second place. The South is in third place, the same as its income rating, while the West falls from second place to fourth place (Figure 3).

Cost of Living: Variations in the cost of living, which is reflected by the metropolitan area exchange rates, remains similar in 2009 to the 2006 rankings.
The Top Ten: The lowest costs of living were in (Table 1):
1. St. Louis, where $0.891 purchased $1.00 in value at the national average.
2. Kansas City, where $0.903 purchased $1.00 in value at the national average.
3. Cleveland, where $0.921 purchased $1.00 in value at the national average.
4. Pittsburgh, where $0.941 purchased $1.00 in value at the national average.
5. Cincinnati, where $0.944 purchased $1.00 in value at the national average.
Rounding out the most affordable 10 are two metropolitan areas in the South (Atlanta and Dallas-Fort Worth), two in the Midwest (Detroit and Milwaukee) and one in the West (Denver). No Northeastern metropolitan area was ranked in the top 10.
| Table 1 | |||
| Estimated Cost of Living: 2009 | |||
| Metropolitan Areas over 1,000,000 with Local CPIs | |||
| Rank | Metropolitan Area |
Metropolitan Exchange Rate: to Purchase $1.00 at National Average
|
Compared to Lowest Cost of Living
|
|
1
|
St. Louis, MO-IL |
$0.891
|
0%
|
|
2
|
Kansas City, MO-KS |
$0.903
|
1%
|
|
3
|
Cleveland, OH |
$0.921
|
3%
|
|
4
|
Pittsburgh. PA |
$0.941
|
6%
|
|
5
|
Cincinnati, OH-KY-IN |
$0.944
|
6%
|
|
6
|
Atlanta. GA |
$0.958
|
8%
|
|
7
|
Detroit. MI |
$0.959
|
8%
|
|
8
|
Milwaukee. WI |
$0.959
|
8%
|
|
9
|
Dallas-Fort Worth, TX |
$0.976
|
10%
|
|
10
|
Denver, CO |
$0.996
|
12%
|
|
11
|
Minneapolis-St. Paul, MN-WI |
$1.000
|
12%
|
|
12
|
Houston, TX |
$1.000
|
12%
|
|
13
|
Tampa-St. Petersburg, FL |
$1.006
|
13%
|
|
14
|
Phoenix, AZ |
$1.011
|
14%
|
|
15
|
Portland, OR-WA |
$1.034
|
16%
|
|
16
|
Chicago, IL-IN-WI |
$1.041
|
17%
|
|
17
|
Philadelphia, PA-NJ-DE-MD |
$1.054
|
18%
|
|
18
|
Baltimore, MD |
$1.068
|
20%
|
|
19
|
Riverside-San Bernardino, CA |
$1.078
|
21%
|
|
20
|
Miami-West Palm Beach, FL |
$1.085
|
22%
|
|
21
|
Seattle, WA |
$1.120
|
26%
|
|
22
|
San Diego, CA |
$1.151
|
29%
|
|
23
|
Boston, MA |
$1.175
|
32%
|
|
24
|
Washington, DC-VA-MD-WV |
$1.181
|
33%
|
|
25
|
Los Angeles, CA |
$1.222
|
37%
|
|
26
|
San Francisco-Oakland, CA |
$1.258
|
41%
|
|
27
|
New York, NY-NJ-PA |
$1.281
|
44%
|
|
28
|
San Jose, CA |
$1.343
|
51%
|
| Estimated from BEA 2006 data, adjusted by local Consumer Price Index for 2006-2009 | |||
The Bottom Ten: The most expensive metropolitan areas were:
28. San Jose, where $1.343 purchased $1.00 in value at the national average.
27. New York, where $1.281 purchased $1.00 in value at the national average.
26. San Francisco, where $1.268 purchased $1.00 in value at the national average.
25. Los Angeles, where $1.222 purchased $1.00 in value at the national average.
24. Washington, where $1.181 purchased $1.00 in value at the national average.
The bottom ten also included three metropolitan areas in the West (Riverside-San Bernardino, San Diego and Seattle), one in the Northeast (Boston) and one in the South (Miami). There were no Midwestern metropolitan areas in the bottom 10.
Per Capita Income: Per capita income in 2009 was then adjusted for the cost of living.
Top Ten:Washington has the highest per capita income, adjusted for the cost of living, at $47,800. San Francisco placed second at $47,500. Denver ranked third at $46,200, while the cost-of-living adjusted income in Minneapolis-St. Paul was $45,800 and $45,700 in Boston. The top 10 also included two Midwestern metropolitan areas (St. Louis and Kansas City), two from the Northeast (Baltimore and Pittsburgh) and one from the West (Seattle).
Bottom Ten: The least affluent metropolitan area was Riverside-San Bernardino, with a per capita income of $27,800. Phoenix was second least affluent at $33,900 while Los Angeles was third least affluent at $35,000. The fourth least affluent metropolitan area was Tampa-St. Petersburg at $36,600 and the fifth least affluent metropolitan area was Portland at $37,400. The bottom 10 also included two metropolitan areas from the South (Atlanta and Miami), two from the Midwest (Cincinnati and Detroit) and one from the West (San Diego).
The cost of living adjusted income data includes surprises. New York, commonly considered a particularly affluent metropolitan area, ranked 17th in cost-of-living adjusted income, and below such seemingly unlikely metropolitan areas as Pittsburgh, Kansas City, Cleveland, St. Louis and Milwaukee. These metropolitan areas also ranked above San Jose, which ranked first in unadjusted income in 2000, but now ranks 16th in cost of living adjusted income (Table 2).
| Table 2 | ||||
| Personal Income Per Capita Adjusted for the Cost of Liviing | ||||
| Metropolitan Areas over 1,000,000 with Local CPIs | ||||
|
Rank (Cost of Living Adjusted)
|
Rank (Unadjusted Income)
|
Metropolitan Area |
Per Capita Income 2009: Adjusted for Cost of Living
|
Per Capita Income 2009: Unadjusted
|
|
1
|
2
|
Washington, DC-VA-MD-WV |
$47,780
|
$56,442
|
|
2
|
1
|
San Francisco-Oakland, CA |
$47,462
|
$59,696
|
|
3
|
8
|
Denver, CO |
$46,172
|
$45,982
|
|
4
|
9
|
Minneapolis-St. Paul, MN-WI |
$45,772
|
$45,750
|
|
5
|
4
|
Boston, MA |
$45,707
|
$53,713
|
|
6
|
18
|
St. Louis, MO-IL |
$45,288
|
$40,342
|
|
7
|
7
|
Baltimore, MD |
$44,908
|
$47,962
|
|
8
|
15
|
Pittsburgh. PA |
$44,848
|
$42,216
|
|
9
|
19
|
Kansas City, MO-KS |
$43,862
|
$39,619
|
|
10
|
6
|
Seattle, WA |
$43,730
|
$48,976
|
|
11
|
13
|
Houston, TX |
$43,581
|
$43,568
|
|
12
|
16
|
Milwaukee. WI |
$43,477
|
$41,696
|
|
13
|
11
|
Philadelphia, PA-NJ-DE-MD |
$43,247
|
$45,565
|
|
14
|
21
|
Cleveland, OH |
$42,734
|
$39,348
|
|
15
|
12
|
Chicago, IL-IN-WI |
$41,990
|
$43,727
|
|
16
|
3
|
San Jose, CA |
$41,255
|
$55,404
|
|
17
|
5
|
New York, NY-NJ-PA |
$40,893
|
$52,375
|
|
18
|
20
|
Dallas-Fort Worth, TX |
$40,494
|
$39,514
|
|
19
|
23
|
Cincinnati, OH-KY-IN |
$40,437
|
$38,168
|
|
20
|
10
|
San Diego, CA |
$39,647
|
$45,630
|
|
21
|
24
|
Detroit. MI |
$39,147
|
$37,541
|
|
22
|
17
|
Miami-West Palm Beach, FL |
$38,124
|
$41,352
|
|
23
|
26
|
Atlanta. GA |
$38,081
|
$36,482
|
|
24
|
22
|
Portland, OR-WA |
$37,446
|
$38,728
|
|
25
|
25
|
Tampa-St. Petersburg, FL |
$36,561
|
$36,780
|
|
26
|
14
|
Los Angeles, CA |
$35,045
|
$42,818
|
|
27
|
27
|
Phoenix, AZ |
$33,897
|
$34,282
|
|
28
|
28
|
Riverside-San Bernardino, CA |
$27,767
|
$29,930
|
| Estimated from BEA 2009 income data and 2006 regional price parity data, adjusted by local Consumer Price Index for 2006-2009 | ||||
Some expensive metropolitan areas such as Washington, San Francisco and Boston ranked at or near the top, but their cost-of-living adjusted incomes were considerably less than the unadjusted incomes. On average, it took $1.20 to purchase $1.00 of value at national rates in these three metropolitan areas. Washington's unadjusted per capita income was 40 percent ($16,100) higher than that of St. Louis, however when the cost of living is factored in, Washington's advantage drops to 6 percent ($2,500).
Caveats: The analysis above does not consider cost-of-living differentials within metropolitan areas. For example, data from the ACCRA cost of living index indicates generally higher prices in the cores of the largest metropolitan areas, such as New York (especially Manhattan), Chicago and San Francisco. Further, these data make no adjustment for relative levels of taxation. A cost of living analysis using disposable income would produce different results, dropping higher taxed metropolitan areas to lower rankings and raising lower taxed metropolitan areas higher.
Cost of Living Differences: Will They Continue? The spread in cost-of-living between metropolitan areas have been driven wider over the last decade by the relative escalation of house prices in some metropolitan areas in the West, Florida and the Northeast. Whether these shifts in cost of living will be reflected in migration patterns will be one of the things to look for in the new Census.
---------
Note 1: Purchasing power parity data is published by the World Bank, the International Monetary Fund (IMF) and the Organization for Economic Cooperation and Development (OECD).
Note 2: The BEA research applied regional price parity factors only to employee compensation and excluded other income. It is possible that, had the analysis been expanded to these other forms of income, the differences in cost of living would have been greater.
Photo: Rosslyn, VA business district, Washington (by author)
Wendell Cox is a Visiting Professor, Conservatoire National des Arts et Metiers, Paris and the author of “War on the Dream: How Anti-Sprawl Policy Threatens the Quality of Life”


great
I have already bookmarked it.It was really a good read. I also think quality is vitally important ! But saying that, your articles are always a fab read., Keep up the good work.how to sell my house fast
Seems to be incomplete
Where are Columbus, OH and Indianapolis, IN... two of cheapest cities (over 1 million people)? Seems to be an incomplete data set.
Great post
Great post with a lot of very usefull resources. Thanks for sharing.Before the game, in the stadium: Wed 22nd Sept 2010 LFC vs NTFC.
Dataset
As the article indicates, only metropolitan areas covered by specific metropolitan area CPIs are included. There are no CPIs for IPS, COL or 22 other major metropolitan areas (those over 1,000,000 population).
Thank you for the inquiry.
Wendell Cox
Demographia
www.demographia.com