Metropolitan area results are beginning to trickle in from the 2010 census. They reveal that, at least for the major metropolitan areas so far, there is little evidence to support the often repeated claim by think tanks and the media that people are moving from suburbs to the historical core municipalities. This was effectively brought to light in a detailed analysis of Chicago metropolitan area results by New Geography’s Aaron Renn. This article analyzes data available for the eight metropolitan areas with more than 1 million population for which data had been released by February 20.
Summary: Summarized, the results are as follows. A detailed analysis of the individual metropolitan areas follows (Table 1).
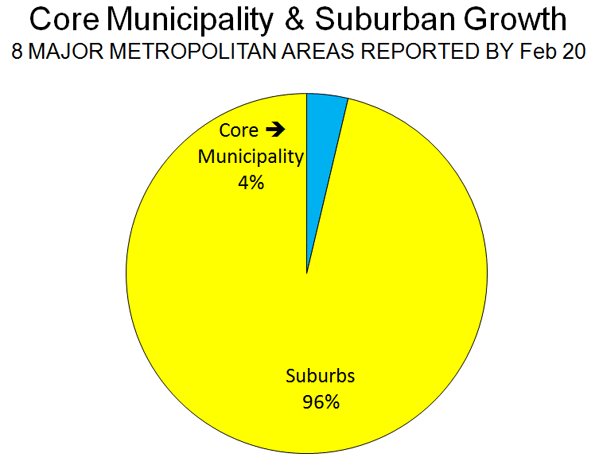
- In each of the eight metropolitan areas, the preponderance of growth between 2000 and 2010 was in the suburbs, as has been the case for decades. This has occurred even though two events – the energy price spike in mid-decade and the mortgage meltdown – were widely held to have changed this trajectory. On average, 4 percent of the growth was in the historical core municipalities, and 96 percent of the growth was in the suburbs (Figure 1).
- In each of the eight metropolitan areas, the suburbs grew at a rate substantially greater than that of the core municipality. The core municipalities had an average growth from 2000 to 2010 of 3.2 percent. Suburban growth was 21.7 percent, nearly 7 times as great. Overall, the number of people added to the suburbs was 14 times that added to the core municipalities.
| Table 1: | |||
| Metropolitan Area Population: 2000-2010 | |||
| 2000 Population | |||
| Historical Core Municipality | Suburbs | Metropolitan Area | |
| Austin | 656,562 | 593,201 | 1,249,763 |
| Baltimore | 651,154 | 1,901,840 | 2,552,994 |
| Chicago | 2,895,671 | 6,053,068 | 8,948,739 |
| Dallas-Fort Worth | 1,188,580 | 3,972,964 | 5,161,544 |
| Houston | 1,953,631 | 2,761,776 | 4,715,407 |
| Indianapolis | 860,454 | 664,650 | 1,525,104 |
| San Antonio | 1,144,646 | 567,057 | 1,711,703 |
| Washington | 572,059 | 4,181,934 | 4,753,993 |
| Total | 9,922,757 | 20,696,490 | 30,619,247 |
| 2010 Population | |||
| Austin | 790,390 | 925,899 | 1,716,289 |
| Baltimore | 620,961 | 2,089,528 | 2,710,489 |
| Chicago | 2,695,598 | 6,599,081 | 9,294,679 |
| Dallas-Fort Worth | 1,197,816 | 5,173,957 | 6,371,773 |
| Houston | 2,099,451 | 3,846,449 | 5,945,900 |
| Indianapolis | 903,393 | 852,848 | 1,756,241 |
| San Antonio | 1,327,407 | 815,101 | 2,142,508 |
| Washington | 601,723 | 4,883,034 | 5,484,757 |
| Total | 10,236,739 | 25,185,897 | 35,422,636 |
| Change: 2000-2010 | |||
| Austin | 133,828 | 332,698 | 466,526 |
| Baltimore | (30,193) | 187,688 | 157,495 |
| Chicago | (200,073) | 546,013 | 345,940 |
| Dallas-Fort Worth | 9,236 | 1,200,993 | 1,210,229 |
| Houston | 145,820 | 1,084,673 | 1,230,493 |
| Indianapolis | 42,939 | 188,198 | 231,137 |
| San Antonio | 182,761 | 248,044 | 430,805 |
| Washington | 29,664 | 701,100 | 730,764 |
| Total | 313,982 | 4,489,407 | 4,803,389 |
| Percentage Change: 2000-2010 | |||
| Austin | 20.4% | 56.1% | 37.3% |
| Baltimore | -4.6% | 9.9% | 6.2% |
| Chicago | -6.9% | 9.0% | 3.9% |
| Dallas-Fort Worth | 0.8% | 30.2% | 23.4% |
| Houston | 7.5% | 39.3% | 26.1% |
| Indianapolis | 5.0% | 28.3% | 15.2% |
| San Antonio | 16.0% | 43.7% | 25.2% |
| Washington | 5.2% | 16.8% | 15.4% |
| Total | 3.2% | 21.7% | 15.7% |
| Chicago excludes Kenosha County, WI | |||
| Washington excludes Jefferson County, WV | |||
| Indianapolis core municipality: Indianapolis & Marion County | |||

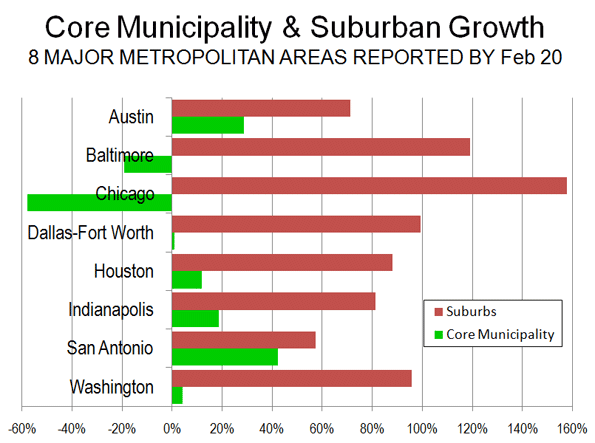
Analysis of Individual Metropolitan Areas: The major metropolitan areas for which data is available are described below in order of their population size (Figure 2 and Table 1).
Chicago:The core municipality of Chicago lost 200,000 residents between 2000 and 2010. Suburban growth was 546,000, adding up to total metropolitan area growth of 346,000 people. The suburbs accounted for 158 percent of the metropolitan area growth. The core municipality decline was stunning in the face of the much ballyhooed urban renaissance in that great city. Yet this renaissance was limited enough as to not lead to an expanding population.
The decline in the core municipality population represents a major departure from the 2009 Bureau of the Census estimates, which would have implied a 2010 population at least 170,000 higher (assumes the growth rate of 2008 two 2009).
Instead all of the growth was in the outer suburbs, beyond the inner suburbs of Cook County.
Dallas-Fort Worth: The historical core municipality of Dallas had a modest population increase of 9000, or less than 1 percent between 2000 and 2010. In contrast, the suburbs experienced an increase of 1.2 million, or 30 percent. Thus, approximately 1 percent of the metropolitan area growth was in the core municipality, while 99 percent was in the suburbs, most of it in the outer suburbs. The inner suburbs added 14 percent to their 2000 population, while the outer suburbs added 36 percent.
The population figure for the core municipality of Dallas – consistently among the strong core areas – was surprisingly low, at 9 percent below (117,000) the expected level. The suburban population was 1 percent (71,000) below expectations.
Houston: The historical core municipality of Houston had comparatively strong population growth, adding 146,000 and 8 percent to its 2000 population. However this figure was 8 percent, or 174,000 below the expected figure. By contrast, the suburban growth was 39 percent, more than five times that of the central jurisdiction. The suburban population growth was 1,085,000, more than six times that of the core jurisdiction. The suburban population was 4 percent or 144,000 higher than expected.
The core jurisdiction of Houston accounted for 12 percent of the metropolitan area growth while the suburbs s accounted for 88 percent. This was evenly distributed between the inner suburbs of Harris County and the outer suburbs. The inner suburbs added 38 percent to their population while the outer suburbs added 41 percent.
Washington:Reversing a decade's long trend, the historical core jurisdiction of Washington (DC) had a small population gain between 2000 and 2010. But the Washington, DC gain of 30,000 pales by comparison to the suburban gain, which was more than 20 times greater, at 700,000. The core jurisdiction accounted for 4 percent of the population gain, while the suburbs accounted for 96 percent.
More than 60 percent of the growth in the metropolitan area was outside the inner suburban jurisdictions that border Washington, DC (Arlington County and Alexandria in Virginia, together with Montgomery County and Prince George's County in Maryland), while the inner suburbs accounted for 36 percent of the growth. The population increase in the inner suburbs was 9 percent, compared to 37 percent in the outer suburbs.
Jefferson County in West Virginia was not included in the analysis because data is not yet available.
Baltimore: The historical core municipality of Baltimore, the site of another ballyhooed urban comeback, lost 30,000 people, or 5 percent of its 2000 population. Baltimore's 2010 population was 4 percent or 16,000 below the expected level. The suburbs experienced a 10 percent or 188,000 person increase. The region’s population increase was roughly equal in numbers between the inner suburbs and the outer suburbs, although the exurban percentage increase was nearly twice as large.
San Antonio:The historical core municipality of San Antonio experienced the largest population increase among the eight metropolitan areas, at 183,000, a roughly 16 percent population jump. The city of San Antonio accounted 43 percent of the growth while suburbs in Bexar County and further out accounted for a larger 57 percent. However, the suburban population increase was 248,000 or 44 percent. This is something of a turnaround in trends that favored the city of San Antonio in the past because of its vast sprawl and predominant share of the metropolitan population.
The city of San Antonio population was 5 percent or 65,000 people short of the expected 2010 level. The suburban population was 15 percent more or 104,000 more than the expected level.
Indianapolis:The historical core area of Indianapolis and Marion County (including enclaves within Indianapolis) grew 5 percent and accounted for 19 percent of the metropolitan area growth. In contrast, the surrounding suburbs grew 28 percent, representing r 81 percent of the metropolitan area growth. Overall, the core municipality added 44,000 people, while the suburbs added more than four times as many, at 188,000.
Austin:The historical core municipality of Austin experienced the greatest growth of any core jurisdiction in the eight metropolitan areas, at 20 percent. Even so, growth in the suburban areas was nearly 3 times as high at 56 percent. The city of Austin accounted for 29 percent of the metropolitan area population growth, while the suburbs accounted for 71 percent. Overall, the central municipality grew 134,000, while the suburbs grew 2.5 times as much, at 333,000.

Generally it is fair to say that, so far, suburban areas are growing far faster than urban cores. In addition, most of the fastest growing core municipalities are those areas that are themselves largely suburban, particularly in relatively young cities like San Antonio, Houston and Austin.
Among the eight metropolitan areas analyzed, the older core jurisdictions (with median house construction dates preceding 1960) tended to either lose population or grow modestly. This is illustrated by the city of Chicago, with a median house construction date of 1945, Baltimore with a median house construction date of 1946 and Washington with a median house construction date of 1949 (Table 2). Generally, the central jurisdictions with greater suburbanization (with median house construction dates of 1960 or later) grew more quickly. For example, highly suburban central jurisdictions like Austin with a median house construction date of 1983 and San Antonio, with a median house construction date of 1970, grew fastest. So much for the long forecast, and apparently still elusive, “return to the city”.
| Table 2: | |||
| Historical Core Municipalities: Growth & Median House Age | |||
| Historical Core Municipality | |||
| Growth: 2000-2010 | Share of Metropolitan Growth | Median House Construction Year | |
| Austin | 20.4% | 28.7% | 1983 |
| Baltimore | -4.6% | -19.2% | 1946 |
| Chicago | -6.9% | -57.8% | 1945 |
| Dallas-Fort Worth | 0.8% | 0.8% | 1974 |
| Houston | 7.5% | 11.9% | 1975 |
| Indianapolis | 5.0% | 18.6% | 1967 |
| San Antonio | 16.0% | 42.4% | 1979 |
| Washington | 5.2% | 4.1% | 1949 |
| Average | 3.2% | 3.7% | |
Wendell Cox is a Visiting Professor, Conservatoire National des Arts et Metiers, Paris and the author of “War on the Dream: How Anti-Sprawl Policy Threatens the Quality of Life”


Yearly figures
I'd be curious to see the year-to-year breakdown of Table 1. The reader has a limited snapshot by only viewing 2000 and 2010. A yearly breakdown could indicate that there's a slowdown in suburban growth or vice versa. It would also be interesting to see the figures from 2008 and 2009, which was the beginning of the recession and when many of the major home builders halted construction.
Straw Man
I doubt anyone has said the cities were growing faster than the suburbs. The point was the cities were growing faster than they have in past decades which is supported by your own statement: "Reversing a decades long trend, the historical core jurisdiction of Washington (DC) had a small population gain between 2000 and 2010"
Is Fort Worth really a suburb of Dallas?
Mr. Cox,
I wonder why your data for Dallas-Fort Worth implies that Fort Worth is not a 'historic core municipality' like Dallas. It is true that Fort Worth experienced a phenomenal rate of growth this past decade that is comparable to other suburbs in the region, but its identity as a core city is very distinct. I think most people in the North Texas Metroplex consider their region to be anchored by two cities, not one. Considering the perpetual rivalry between Dallas and Fort Worth, the fact that the former grew by only 0.8% definitely has dampened the spirits of Dallas residents.
Suburban Growth
Of course suburbs are growing faster than core cities. That's where the land is available for development. A more valid and interesting comparison would be to look at downtown residential growth over the past decade compared to suburban residential growth. Most core cities are essentially built out. Except for brownfield sites, there is very little land available for development, and what there is often lacks basic infrastructure -- good streets, sewers, schools, fire stations, police stations, and other essentials. The other factor ignored by Mr. Cox is the question: who is moving in from the suburbs and who is moving out to the suburbs? Evidence shows that families, and especially minority families with school age children, are moving to the suburbs because of good jobs and good housing. Empty nesters, by contrast, are moving downtown to take advantage of cultural activities and institutions, restaurants and nightlife. This would be a much more valuable article if it were more balanced and nuanced in its approach.
Can we see some data?
"Empty nesters, by contrast, are moving downtown"
Some data please to support this assertion.
Thanks.
Dave Barnes
+1.303.744.9024
WebEnhancement Services Worldwide
Can we see some data?
"Empty nesters, by contrast, are moving downtown"
Some data please to support this assertion.
Thanks.
Dave Barnes
+1.303.744.9024
WebEnhancement Services Worldwide
Data disproves meme. Oops.
I still want to live in the city.
I still live in the city.
I plan to continue to live in the city.
Dave Barnes
+1.303.744.9024
WebEnhancement Services Worldwide