
In response to the outcry by job creators about proposed new Nitrogen Oxides emission regulations, the Obama Administration has suspended a planned expansion of these rules.
The Public Health Risks of Densification
The purpose of local air pollution regulation is to improve public health. For years, regional transportation plans, public officials, and urban planners have been seeking to densify urban areas, using strategies referred to as “smart growth” or “livability.” They have claimed that densifying urban areas would lead to lower levels of air pollution, principally because it is believed to reduce travel by car. In fact, however, EPA data show that higher population densities are strongly associated with higher levels of automobile travel and more intense air pollution emissions from cars and other highway vehicles. In short, higher emissions cause people to breathe more in air pollution, which can be unhealthful. To use a graphic example, a person is likely to encounter a greater chance of health risk by breathing intense smoke from a fire than if they are far enough from the fire to dilute the intensity of the smoke.
Overall, more intense air pollution detracts from public health. To put in the economic terms that appear so often in planning literature on "urban sprawl," more intense traffic congestion and the consequent higher air pollution emissions are negative externalities of smart growth and densification.
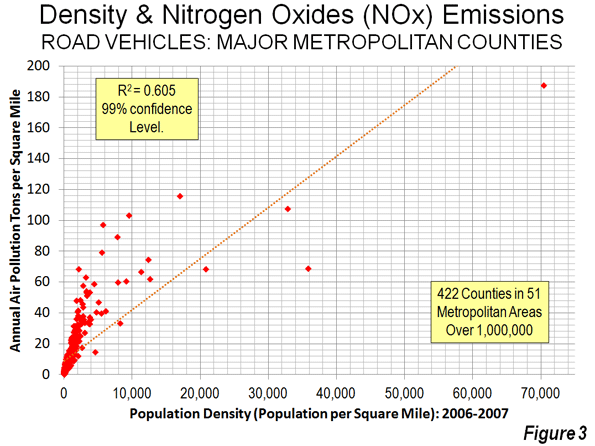
This is illustrated by county-level data for nitrogen oxides (NOx) emissions, which is an important contributor to ozone formation. This analysis includes the more than 420 counties in the nation’s major metropolitan areas (those with more than 1 million in population).
Seven of the 10 counties with the highest NOx emissions concentration (annual tons per square mile) in major metropolitan areas are also among the top 10 in population density (2008). The densest, New York County (Manhattan), has by far the most intense NOx emissions. Manhattan also has the highest concentration of emissions for the other criteria air pollutants, such as carbon monoxide, particulates, and volatile organic compounds (2002 data). New York City’s other three most urban counties (Bronx, Kings, and Queens) are more dense than any county in the nation outside Manhattan, and all land among the top 10 in NOx emission density (Table 1).
| Table 1 | ||
| Intensity of Nox Emissions (per Square Mile) | ||
| NOx Emissions | ||
| Rank | County | Compared to Average |
| 1 | New York Co, NY | 23.8 |
| 2 | San Francisco Co, CA | 14.7 |
| 3 | Bronx Co, NY | 13.7 |
| 4 | Washington city, DC | 13.1 |
| 5 | St. Louis city, MO | 12.4 |
| 6 | Arlington Co, VA | 11.3 |
| 7 | Cook Co, IL | 10.0 |
| 8 | Suffolk Co, MA | 9.5 |
| 9 | Kings Co, NY | 8.7 |
| 10 | Queens Co, NY | 8.7 |
| Calculated from 2008 EPA Data | ||
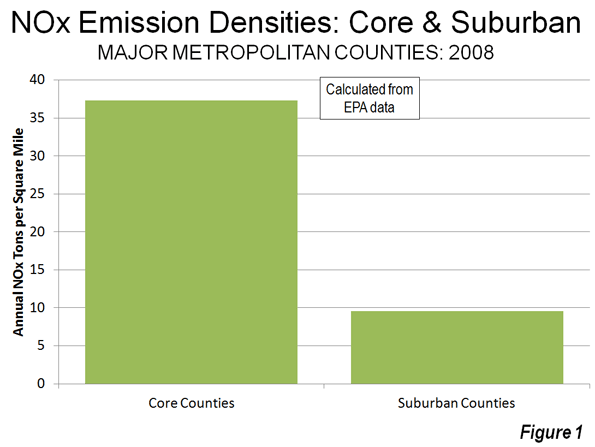
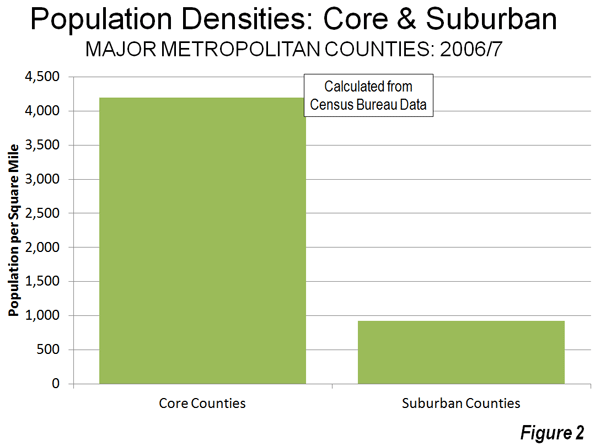
NOx emission density data by county is provided in the document below, Annual Density of Highway Vehicle NOx Emissions by County: 2008. Overall, this data indicates that the average core county had a NOx density 3.9 times that of the average suburban county (Figure 1). By contrast, the average core county density is 4.5 times that of the average suburban county (Figure 2), indicating a strong relationship that is also shown in Figure 3.
For example, in the New York metropolitan area, core New York County has NOx emissions that are nearly 15 times as intense in a given volume of air as suburban Morris County. In the Cleveland metropolitan area, core Cuyahoga County has a NOx emissions intensity 12 times that of suburban Geauga County. Charlotte's core Mecklenberg County has a NOx emissions intensity more than five times that of suburban Union County.
Traffic and Air Pollution
More concentrated traffic also leads to greater traffic congestion and more intense air pollution, according to data available from EPA. The data for traffic concentration is similar to population density. Manhattan – despite its huge transit complex – has by far the greatest miles of road travel per square mile of any county, while seven of the densest counties are among the top ten in traffic intensity. As in the case of NOx emissions, the four highly urbanized New York City counties are also among the top 10 in the density of motor vehicle travel (Table 1).
| Table 2 | ||
| Intensity of Traffic (per Square Mile) | ||
| Motor Vehicle Travel | ||
| Rank | County | Compared to Average |
| 1 | New York Co, NY | 37.8 |
| 2 | Bronx Co, NY | 22.3 |
| 3 | Fredericksburg city, VA | 19.9 |
| 4 | Alexandria city, VA | 15.8 |
| 5 | San Francisco Co, CA | 15.6 |
| 6 | Arlington Co, VA | 15.1 |
| 7 | Suffolk Co, MA | 14.4 |
| 8 | Queens Co, NY | 14.3 |
| 9 | Kings Co, NY | 13.8 |
| 10 | Washington city, DC | 13.1 |
| Calculated from 2005 EPA Data | ||
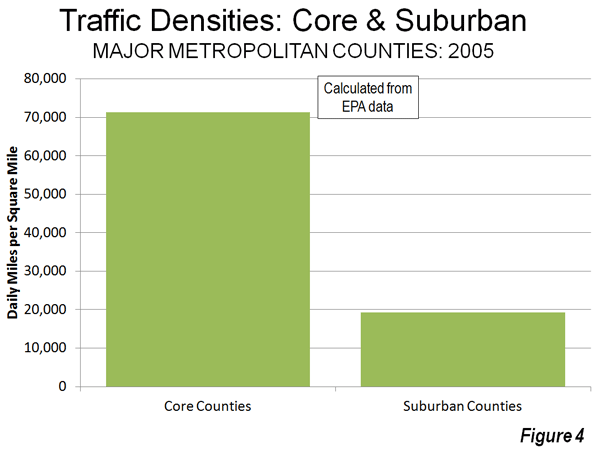
Traffic density data by county is provided in the second document below, Daily Density of Road Vehicle Miles by County: 2005. Overall, this data indicates that the average core county had a traffic density 3.7 times that of the average suburban county (Figure 4), again a difference similar to the difference in density (Figure 5).
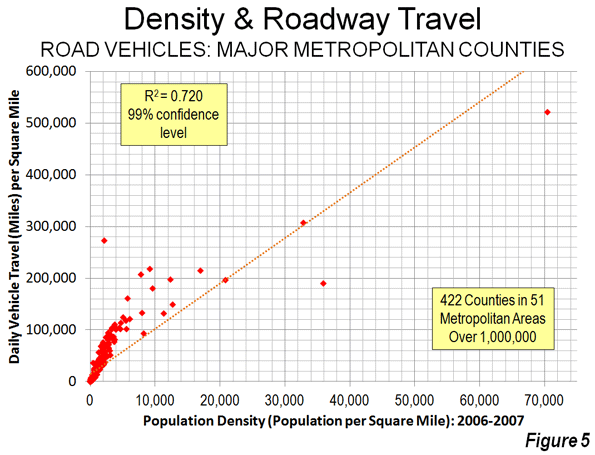
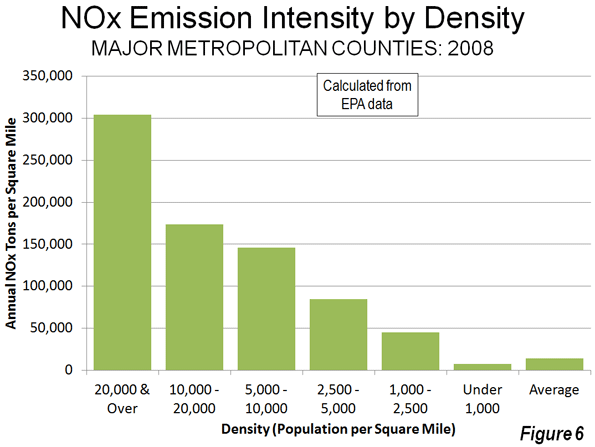
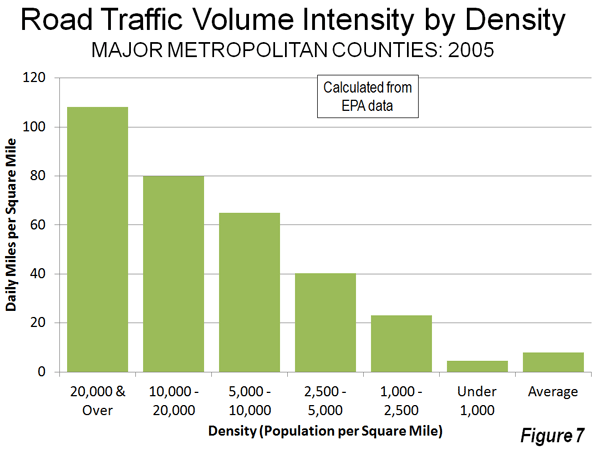
The overall relationship between higher population densities and both NOx concentration and motor vehicle traffic intensity is illustrated in Figure 6 and Figure 7. There is a significant increase in the concentration of both NOx emissions and motor vehicle travel in each higher category of population density. For example, the counties with more than 20,000 people per square mile have NOx emission concentrations 14 times those of the average county in these metropolitan areas, and motor vehicle travel is 22 times the average. A smaller sample of the most urbanized counties (those with 90 percent or more of the land urbanized) showed a stronger association. This findings are consistent with research by the Sierra Club and a model derived from that research by ICLEI–Local Governments for Sustainability, both strong supporters of the livability and smart growth strategies of densification.
A Caution: The air pollution data contained in this report is for emissions, not for air quality. Air quality is related to emissions and if there were no other intervening variables, it could be expected that emissions alone would predict air quality. However there are a number of intervening variables, from climate, wind, topography and other factors. Again, Los Angeles County makes the point. As the highest density large urban area in the nation Los Angeles under any circumstances would have among the highest density of air pollution emissions. However, the situation in Los Angeles is exacerbated by the fact that the urban area is surrounded by mountains which tend to trap the air pollution that is blown eastward by the prevailing westerly winds.
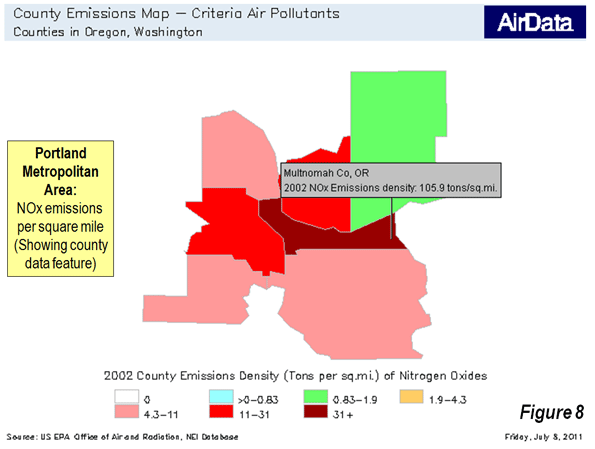
The EPA data for 2002 can be used to create maps indicating criteria pollutant densities within metropolitan areas. An example is shown of the Portland (OR-WA) metropolitan area (Figure 8), with the latter indicating the data illustration feature using Multnomah County (the central county of the metropolitan area), which is the most dense county and has the greatest intensity of NOx emissions and traffic congestion.
The Goal: Improving Public Health
These data strongly indicate that the densification strategies associated with smart growth and livability are likely to worsen the intensity of both NOx emissions and congestion of motor vehicle travel.
But there is a more important impact. A principal reason for regulating air pollution from highway vehicles is to minimize public health risks. Any public policy that tends to increase air pollution intensities will work against the very purpose of air pollution regulation: public health. The American Heart Association found that air pollution levels vary significantly in urban areas and that people who live close to highly congested roadways are exposed to greater health risks. The EPA also notes that NOx emissions are higher near busy roadways. The bottom line is that all – things being equal – higher population density, more intense traffic congestion, and higher concentrations of air pollution go together.
All of this could have serious consequences as the EPA seeks to expand its misguided regulations. For example, officials in the Tampa-St. Petersburg area have expressed concern that the metropolitan area will not meet the new standards, and they have proposed densification as a solution, consistent with the misleading conventional wisdom. The reality is that this is likely to make things worse, not better.
Less Livable
There are myriad difficulties with smart growth and livability policies, not least their association with higher housing prices, a higher cost of living, muted economic growth, and decreased mobility and access to jobs in metropolitan areas. As the EPA data show, the densification policies of smart growth and livability also make air pollution worse for people at risk.
Virtually all urban areas of Western Europe, North America and Oceania principally rely on cars for their mobility and there is no indicate that this will change. The air is less healthful for residents where traffic intensity is greater. As the air pollution intensity data shows, cars need space.
Wendell Cox is a Visiting Professor, Conservatoire National des Arts et Metiers, Paris and the author of “War on the Dream: How Anti-Sprawl Policy Threatens the Quality of Life”
-----
Note 1: The city (county level jurisdiction) of Fredericksburg, Virginia surprisingly ranks third in its concentration of motor vehicle travel yet ranks eighth much lower in population density. This reflects the high volumes of traffic through the small municipality (and county-equivalent jurisdiction) carried on two of the East's busiest roadways, Interstate 95 and US-1.
Note 2: Additional analysis and information is available at Air Pollution, NOx Emissions, Traffic Congestion and Higher Population Density: The Association in Major Metropolitan Areas of the United States.
Adapted from an article published by the Heritage Foundation.
Photo of Manhattan traffic by carthesian.


