The Federation of Canadian Municipalities (FCN) and the Canadian Urban Transit Association (CUTA) have expressed serious concern about generally longer commute trip times making Canadian metropolitan areas less competitive. Each has called for additional funding for transit at the federal level to help reduce commute times and improve metropolitan competitiveness.
The Right Concern
The concern over commute times is well placed. Economic research generally concludes that greater economic and employment growth is likely where people can quickly reach their jobs in the metropolitan area. Five of the nation's six major metropolitan areas (Toronto, Montréal, Vancouver, Ottawa-Gatineau and Calgary) have average one-way work trip travel times that are among the highest in their size classes among 109 metropolitan areas in the more developed world for which data is available. Only Edmonton has an average commute time that is among the shortest (Table 1).
| Table 1 | ||||
| Average One-way Commute Times: Major Metropolitan Areas | ||||
| Compared with International Major Metropolitan Areas | ||||
| Major Metropolitan Area | One-way Commute Time (Minutes) | Overall One-way Commute: Rank out of 109 | One-way Commute: Rank in Population Class | |
| Population Size Class | ||||
| Toronto | 33 | 97th | Over 5,000,000 | 11th out of 19 |
| Montréal | 31 | 90th | 2,500,000 - 5,000,000 | 19th out of 23 |
| Vancouver | 30 | 86th | 1,000,000 - 2,500,000 | 60th out of 67 |
| Ottawa-Gatineau | 27 | 60th | 1,000,000 - 2,500,000 | 55th out of 67 |
| Calgary | 26 | 58th | 1,000,000 - 2,500,000 | 50th out of 67 |
| Edmonton | 23 | 15th | 1,000,000 - 2,500,000 | 15th out of 67 |
The Wrong Answer
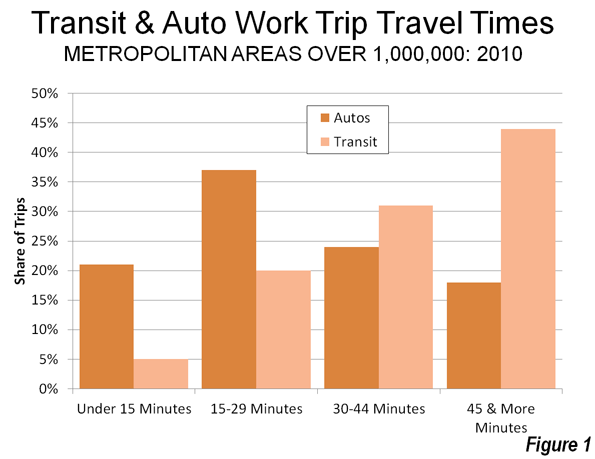
Yet the solution – more transit and funding for transit – misses the mark. Transit does many things well, but it does not reduce commute times (Figure 1). According to Statistics Canada, average commute times by transit in the Toronto, Montréal and Vancouver metropolitan areas are from 30 per cent longer to nearly double those of average automobile commuters (Note 2). Some 58 percent of car users (drivers and passengers) reach their work locations in under 30 minutes, something accomplished by merely y 25 percent of transit commuters. Overall Toronto commute times are longer than either Los Angeles – famed for its traffic – as well as much less dense, and far less transit dependent, Dallas-Fort Worth. In Toronto, 21 percent of commuters take transit, compared to two percent in Dallas-Fort Worth. Among Montréal commuters, 20 percent use transit and spend more time commuting than their counterparts in more decentralized Phoenix, where less than two percent take transit. Commute times in transit-focused Vancouver are worse than much larger Los Angeles and indeed longer than nearly American metropolitan area, including Dallas-Fort Worth, Houston, and Philadelphia (Table 2).
Given this pattern, transferring car travel to transit likely would increase commute times and make metropolitan areas even less competitive.

| Table 2 | |||
| 30- and 40-minute Commute Shares: | |||
| Representative Metropolitan Areas | |||
| Population Classification | Work Trip Under 30 Minutes | Work Trip 30 to 44 Minutes | Work Trip Under 45 Minutes |
| 5,000,000 and Over | |||
| Dallas-Fort Worth | 59% | 24% | 83% |
| Los Angeles | 55% | 24% | 79% |
| Toronto | 48% | 25% | 73% |
| Paris | 45% | 22% | 67% |
| 2,500,000 - 5,000,000 | |||
| Phoenix | 57% | 26% | 83% |
| Montréal | 47% | 27% | 74% |
| 1,000,000 - 2,500,000 | |||
| Edmonton | 68% | 20% | 88% |
| Indianapolis | 66% | 22% | 88% |
| Ottawa-Gatineau | 65% | 21% | 86% |
| Tampa-St. Petersburg | 62% | 22% | 84% |
| Calgary | 54% | 29% | 83% |
| Vancouver | 55% | 21% | 76% |
| Source: Statistics Canada, U.S. American Community Survey, National Institute of Statistics and Economic Studies (France) | |||
The Geography of Transit
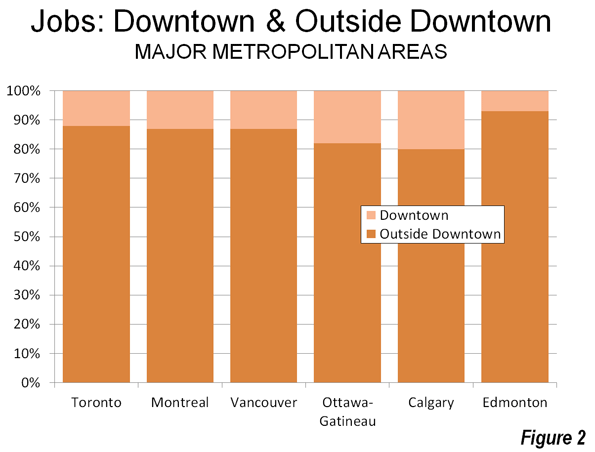
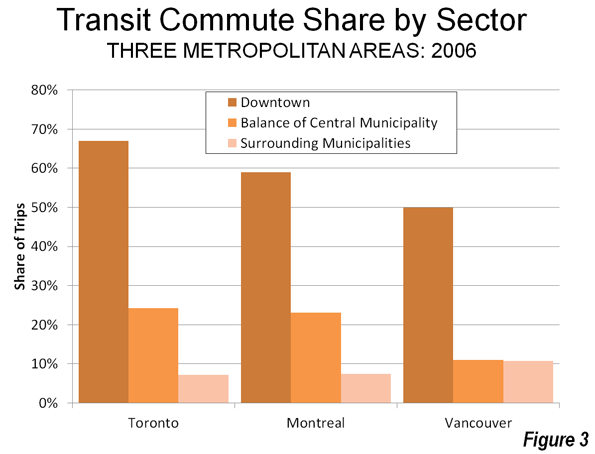
Rational Transit and Downtown:Transit’s greatest strength is in providing access to the largest downtown areas. These areas have the greatest job densities (jobs per square kilometre) in their metropolitan areas and are typically well served by frequent, rapid and convenient transit service from throughout the metropolitan area. This combination of high employment density and superior transit service attracts one-half or more of all downtown commuters in Canada’s major metropolitan areas to transit (Figure 2). Transit is meets the needs of people who commute to downtown and is the rational choice for many, if not most. However, downtowns contain only a relatively small share (14 per cent) of metropolitan area jobs (Figure 3).


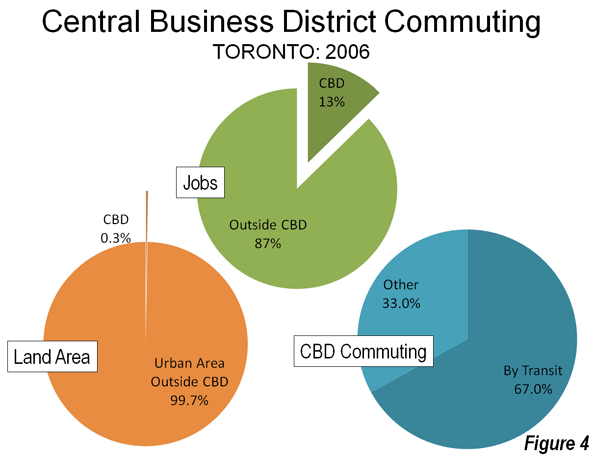
Rational Personal Mobility Elsewhere: Areas outside downtown lack any such intense concentration of jobs. The area outside downtown, accounting for 6 out of every 7 jobs (Figure 4), maintain much lower employment densities and generally lacks transit service. This is illustrated by the nation's largest employment center, which surrounds Pearson International Airport in Toronto. Its more than 350,000 employees are spread around an area the size of city of Vancouver (or the city of San Francisco) at a density so low that quick and efficient transit is simply impossible.
For the overwhelming share of work trips to outside the downtown area, the car does the job and transit accounts for less than 10 percent of commuters. Thus, the automobile is the rational choice for most people who commute to locations outside downtown. And things are not getting better for transit. According to Statistics Canada, employment has been growing much faster outside of downtown than in the high density core areas suited for transit. The 2011 census indicated a continuing dispersion of population as well.

Transit's Robust Funding Growth and Declining Productivity
Strongly Rising Transit Subsidies: Transit subsidies have been growing strongly. According to Transport Canada data, from 1999 to 2008 subsidies grew 83 percent (adjusted for inflation), which is more than three times the 26 percent ridership growth rate and 3.5 times the rate of general inflation. Transit’s declining productivity could indicate a substantial potential for improved cost effectiveness and service expansion within the generous present funding levels.
Declining Transit Productivity: At the same time, there are concerns about transit productivity. The Conference Board of Canada has documented a 1.2 percent annual decline in productivity for two decades. The same analysis found productivity in other transport sectors to be generally improving. Transit costs have risen well in excess of inflation, service levels and ridership. Rising costs seriously limit transit’s ability to increase its share of travel in metropolitan areas and limits the important role that it is called upon to play in providing door-to-door mobility for the transportation-impaired, such as disabled citizens, the elderly, and students.
Land Use Strategies that Retard Metropolitan Competitiveness
Policies that Could Make Metropolitan Areas Less Competitive: While the prospects for improving transit commute times are discouraging, some current land use strategies further increase traffic congestion and lengthen commute times and make metropolitan areas and make metropolitan areas less competitive . Compact cities (also called smart growth) policies have been adopted across Canada in an effort to reduce automobile use and increase urban densities. The planning expectation is that housing should be placed near rail stations. Yet job locations throughout metropolitan areas remain highly dispersed, and with the rise of working at home, are becoming more so. The potential for transit systems (or walking or cycling) to materially impact commuting is very limited in the least.
International data indicate that higher densities are associated with greater traffic congestion. Further, higher traffic densities are strongly associated with higher levels of air pollution. Improvements in vehicle technology will make reductions in automobile use to reduce greenhouse gas emissions unnecessary, according to U.S. research by McKinsey & Company. Finally, smart growth type policies have been found to retard metropolitan economic growth in the Netherlands, the United Kingdom and the United States (Note 2).
Improving Metropolitan Competitiveness
Strategies that reduce commute times can improve metropolitan competitiveness. Expanded telecommuting reduces average commute times by its very nature (though the reported commute times routinely exclude the working at home sector, both in Canada and the US). There are also lessons to be learned from Edmonton and the international metropolitan areas that have been more successful in maintaining shorter commutes: more dispersed employment, lower population densities and a larger share of travel by car (Table 3).
| Table 3 | ||||
| Comparison of Canadian and U.S. Major Metropolitan Areas | ||||
| Average One-way Commute Times and Urban Area Densities | ||||
| CANADA | Canada Metropolitan Areas | United States: Metropolitan Area Size Classes | ||
| Commute Time | Principal Population Centre Density (per KM2) | Average Commute Time | Average Principal Population Centre Density (per KM2) | |
| 5,000,000 and Over | ||||
| Toronto | 33 | 2,900 | 28 | 1,400 |
| 2,500,000 - 5,000,000 | ||||
| Montréal | 31 | 2,200 | 26 | 1,200 |
| 1,000,000 - 2,500,00 | ||||
| Vancouver | 30 | 1,900 | 23 | 1,100 |
| Ottawa-Gatineau | 27 | 1,900 | ||
| Calgary | 26 | 1,600 | ||
| Edmonton | 23 | 1,100 | ||
| Principal Population Centre: Largest population centre (Statistics Canada term for urban area) in the metropolitan area. | ||||
Focusing on Objectives: To become more competitive, Canada’s metropolitan areas need to improve their average commute times. This requires focusing on strategies that have the highest potential to reduce traffic congestion.
Residents and businesses in metropolitan areas would be best served by goal-oriented and objective policies squarely directed toward getting people to work faster. The focus should be on what makes commutes shorter, regardless of transport mode, rather than on idealistic notions of how a city should look or how people should travel.
Wendell Cox is a Visiting Professor, Conservatoire National des Arts et Metiers, Paris and the author of “War on the Dream: How Anti-Sprawl Policy Threatens the Quality of Life”.
––--
Note: This article is based upon the recently released Frontier Centre for Public Policy report Improving the Competitiveness of Metropolitan Areas by Wendell Cox, who also serves as a senior fellow at the Centre.
Note 1: Data not provided for other metropolitan areas.
Note 2: On a related note, the Bank of Canada (the central bank) and others have indicated a concern about rising house costs relative to incomes. This is to be expected in metropolitan areas adopting green belts, urban growth boundaries and other land rationing policies. Huge housing price increases have occurred in Vancouver, Toronto, Montréal and Calgary (for example), in response to such policies (This is evident from the annual editions of the Demographia International Housing Affordability Survey, sponsored in Canada by the Frontier Centre for Public Policy). The Bank of Canada may be virtually powerless to slow this loss of housing affordability, since its cause (constraining metropolitan land supply) is beyond the reach of the Bank's monetary policies.
Photo: Suburban Montreal (by author)


