
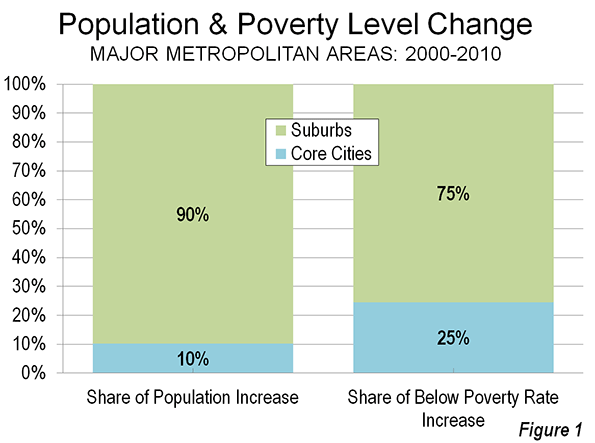
Over the toughest economic decade since Great Depression, the nation's core cities continued to gain more than their share the below poverty line population in the 51 metropolitan areas with more than 1,000,000 population. Between 2000 and 2010, core cities (Note 1) attracted approximately 10 percent of the increase in population (Note 2) while adding 25 percent of the increase in people under the poverty line (Figure 1).
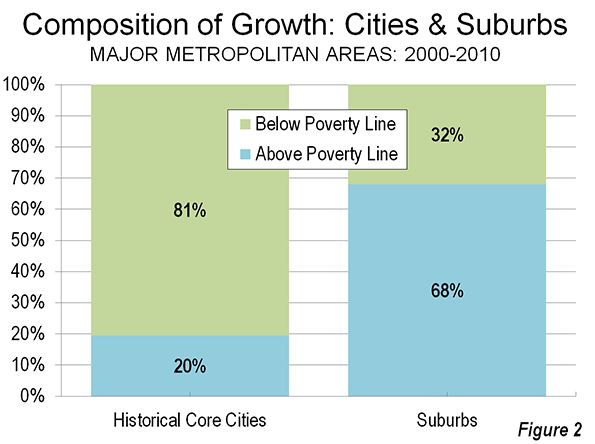
Most New Core City Residents in Poverty: The core city poverty trend was overwhelming. In the core cities of the 51 metropolitan areas with more than 1,000,000 population (2010), 81 percent of the aggregate population increase was under the poverty line. This compares to the 32 percent of the suburban population increase that was below the poverty line. This may be a much lower figure than the concentration in the core cities, but even that also is far too high (Figure 2).
The trend in core city poverty concentration was also pervasive. In 39 of the 51 metropolitan areas, core cities accounted for a greater share of poverty level population growth than overall population growth. One of the exceptions was Louisville, where the core city expanded to nearly six times its 2000 land area and more than doubled its population (Note 3). The result was to convert Louisville into a largely suburban city, which masks the high poverty rate in genuine urban core of the former city.
Poverty in the Suburbs: At the same time, as core city population growth has stalled, much of the numeric increase in the below poverty line population has been in the suburbs. In 2010, the Brookings Institution reported that a majority of the metropolitan population below poverty was in the suburbs (Note 3). This is to be expected, since suburban areas account for nearly 75 percent of major metropolitan area population.
Partially in response to the Brookings Institution finding, there has been some misinterpretation as to the relative economic fortunes of the core cities and the suburbs. This is consistent with the continuing "drumbeat" of the "return to the cities," which results of the last definitive ten year census only briefly quieted. The "great inversion" cited by Aaron Ehrenhalt and others, wherein the affluent "flock" (the recurring term) to the cities, as the suburbs are ghettoized, remains far from an actual reality.
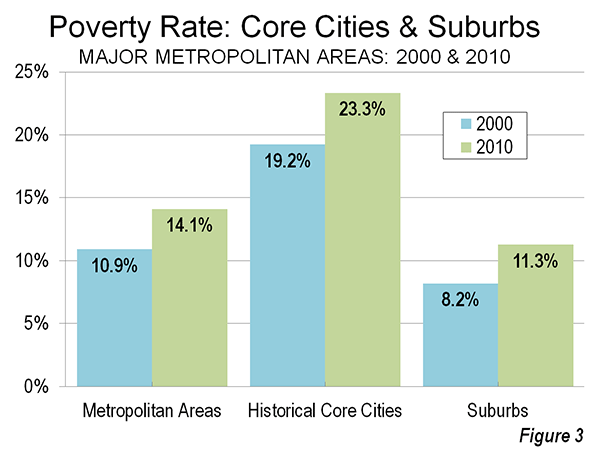
Overall the average major metropolitan area poverty rate rose from 10.9 percent in 2000 to 14.1 percent in 2010. Rather than gentrify, the core city rate rose from 19.2 percent to 23.3 percent, while the suburban rate rose from 8.2 percent to 11.3 percent (Figure 3).
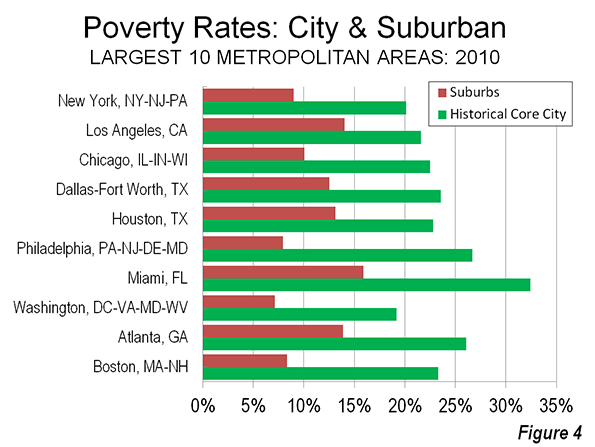
Core City Poverty Rates Double the Suburbs: In 2010, core city poverty rates were higher in every major metropolitan area than in the suburbs. Overall, average core city poverty rates were more than double that of the suburbs in most metropolitan areas (27 of 51). Among the 10 largest metropolitan areas, the core cities of New York, Chicago, Houston, Philadelphia, Miami, Washington and Boston (Figure 4) suffered poverty rates more than double those of their suburbs. The cities of Milwaukee and Hartford had the highest poverty rates relative to their suburbs, at four or more times.
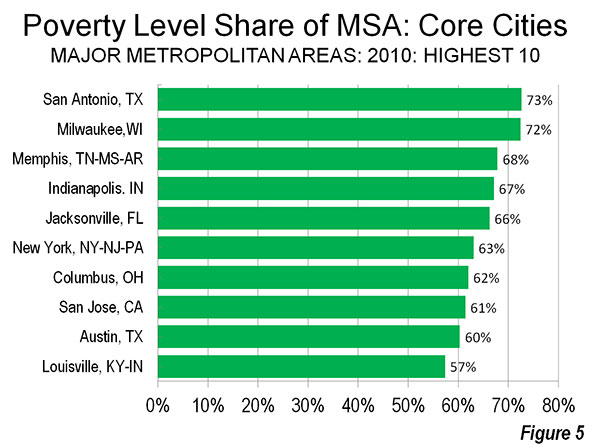
Shares of Poverty Level Population in the Core Cities: On average, 41 percent of metropolitan area populations living below the poverty rate resided in the core cities. The city of San Antonio had the highest share of its metropolitan below poverty population, at 73 percent, followed closely by the city of Milwaukee, at 72 percent. New York City accounted for 63 percent of its metropolitan below poverty line population and the city of San Jose 61 percent. Even after incorporating suburbs, the city of Louisville contained 57 percent of its metropolitan below poverty level population (Figure 5).
Highlights of the 2010 Data: The 2010 poverty rates for metropolitan areas, core cities and suburbs are shown in the table below. Highlights of the data are described below:
Metropolitan Areas: The highest metropolitan area poverty rates were in Memphis (19.1 percent), New Orleans (17.4 percent) and Riverside-San Bernardino (17.1 percent). The lowest metropolitan area poverty rates were in Washington (8.4 percent), Hartford (10.1 percent) and Boston (10.3 percent).
Core Cities: The city of Detroit had the highest poverty rate, at 37.6 percent, The city of San Bernardino, whose city council voted to file for bankrupcty on July 10, had the second highest poverty rate at 34.6 percent, and Cleveland ranked third highest, at 34.0 percent. The lowest core city poverty rates were in high-tech centers, the city of San Jose (12.6 percent), the city of Seattle (14.7 percent and in the two core cities of San Francisco-Oakland (15.7 percent). Despite the strong metropolitan area showing (#1) and high suburban ranking (#3), the city of Washington had only the 15th lowest poverty rate among core cities.
Suburbs: The highest suburban poverty rates were in Riverside-San Bernardino (16.2 percent), Miami (15.9 percent) and Oklahoma City (15.2 percent). The lowest suburban poverty rates were in Baltimore (6.7 percent), Milwaukee (6.9 percent) and Washington (7.1 percent), with Baltimore and Washington profiting from strong federal government employment and contracting.
The data reflects the continuation of longer term trends as wealth losses continue to afflict many core cities and as domestic migrants continue to move away (As was previously reported core counties, the lowest level at which there is migration data, have predominantly lost domestic migrants, both between 2000 and 2009 and in the latest estimates, between 2010 and 2011.) The problem, however is much larger. Both the core cities and the suburbs are are challenged by heightened poverty rates. The entire urban form, from the exurbs and the suburbs to the core cities need a substantial reduction in poverty, although present economic trends are working against this result.
| 2010 Poverty Rates: Major Metropolitan Areas, Core Cities & Suburbs | |||||
| Poverty Rates | |||||
| Metropolitan Area (MSA) | Historical Core City (HCM) | MSA | City | Suburbs | City/ Suburbs |
| Atlanta, GA | Atlanta | 14.8% | 26.1% | 13.9% | 1.88 |
| Austin, TX | Austin | 15.9% | 20.8% | 11.7% | 1.78 |
| Baltimore, MD | Baltimore | 11.0% | 25.6% | 6.7% | 3.80 |
| Birmingham, AL | Birmingham | 17.0% | 29.5% | 14.2% | 2.08 |
| Boston, MA-NH | Boston | 10.3% | 23.3% | 8.3% | 2.80 |
| Buffalo, NY | Buffalo | 14.4% | 30.2% | 9.7% | 3.13 |
| Charlotte, NC-SC | Charlotte | 14.5% | 17.2% | 12.6% | 1.36 |
| Chicago, IL-IN-WI | Chicago | 13.6% | 22.5% | 10.0% | 2.24 |
| Cincinnati, OH-KY-IN | Cincinnati | 14.0% | 30.6% | 11.4% | 2.69 |
| Cleveland, OH | Cleveland | 15.1% | 34.0% | 10.7% | 3.19 |
| Columbus, OH | Columbus | 15.7% | 22.6% | 10.5% | 2.16 |
| Dallas-Fort Worth, TX | Dallas | 14.6% | 23.6% | 12.5% | 1.88 |
| Denver, CO | Denver | 12.5% | 21.6% | 9.7% | 2.21 |
| Detroit, MI | Detroit | 16.6% | 37.6% | 12.4% | 3.02 |
| Hartford, CT | Hartford | 10.1% | 31.2% | 7.8% | 3.99 |
| Houston, TX | Houston | 16.5% | 22.8% | 13.1% | 1.74 |
| Indianapolis. IN | Indianapolis | 14.8% | 21.1% | 9.1% | 2.31 |
| Jacksonville, FL | Jacksonville | 15.3% | 16.7% | 13.1% | 1.28 |
| Kansas City, MO-KS | Kansas City | 12.4% | 20.4% | 10.0% | 2.05 |
| Las Vegas, NV | Las Vegas | 15.1% | 16.0% | 14.7% | 1.09 |
| Los Angeles, CA | Los Angeles | 16.3% | 21.6% | 14.0% | 1.54 |
| Louisville, KY-IN | Louisville | 15.3% | 18.9% | 12.2% | 1.55 |
| Memphis, TN-MS-AR | Memphis | 19.1% | 26.5% | 12.0% | 2.20 |
| Miami, FL | Miami | 17.1% | 32.4% | 15.9% | 2.04 |
| Milwaukee,WI | Milwaukee | 15.5% | 29.5% | 6.9% | 4.30 |
| Minneapolis-St. Paul, MN-WI | Minneapolis & St. Paul | 10.9% | 23.7% | 7.6% | 3.10 |
| Nashville, TN | Nashville | 15.4% | 20.8% | 12.2% | 1.71 |
| New Orleans. LA | New Orleans | 17.4% | 27.2% | 13.4% | 2.02 |
| New York, NY-NJ-PA | New York | 13.8% | 20.1% | 9.0% | 2.24 |
| Oklahoma City, OK | Oklahoma City | 15.9% | 16.8% | 15.2% | 1.11 |
| Orlando, FL | Orlando | 14.7% | 18.5% | 14.2% | 1.30 |
| Philadelphia, PA-NJ-DE-MD | Philadelphia | 12.7% | 26.7% | 7.9% | 3.36 |
| Phoenix, AZ | Phoenix | 16.3% | 22.5% | 13.0% | 1.73 |
| Pittsburgh, PA | Pittsburgh | 12.2% | 22.3% | 10.7% | 2.08 |
| Portland, OR-WA | Portland | 13.4% | 18.5% | 11.7% | 1.59 |
| Providence, RI-MA | Providence | 13.7% | 30.5% | 11.7% | 2.60 |
| Raleigh, NC | Raleigh | 12.9% | 18.4% | 10.0% | 1.84 |
| Richmond, VA | Richmond | 11.6% | 25.8% | 8.9% | 2.91 |
| Riverside-San Bernardino, CA | San Bernardino | 17.1% | 34.6% | 16.2% | 2.13 |
| Rochester, NY | Rochester | 14.2% | 33.8% | 9.3% | 3.62 |
| Sacramento, CA | Sacramento | 15.1% | 21.5% | 13.3% | 1.62 |
| St. Louis,, MO-IL | St. Louis | 13.3% | 27.8% | 11.5% | 2.42 |
| Salt Lake City, UT | Salt Lake City | 13.1% | 22.3% | 11.3% | 1.98 |
| San Antonio, TX | San Antonio | 16.3% | 19.1% | 11.7% | 1.64 |
| San Diego, CA | San Diego | 14.8% | 17.4% | 13.0% | 1.34 |
| San Francisco-Oakland, CA | San Francisco & Oakland | 10.9% | 15.7% | 9.0% | 1.74 |
| San Jose, CA | San Jose | 10.6% | 12.6% | 8.4% | 1.49 |
| Seattle, WA | Seattle | 11.7% | 14.7% | 11.1% | 1.33 |
| Tampa-St. Petersburg, FL | Tampa | 15.4% | 21.3% | 14.6% | 1.46 |
| Virginia Beach-Norfolk, VA-NC | Norfolk | 10.6% | 16.4% | 9.7% | 1.69 |
| Washington, DC-VA-MD-WV | Washington | 8.4% | 19.2% | 7.1% | 2.69 |
| Average (Unweighted) | 14.1% | 23.3% | 11.3% | 2.18 | |
| Data from American Community Survey, 2010 | |||||
Wendell Cox is a Visiting Professor, Conservatoire National des Arts et Metiers, Paris and the author of “War on the Dream: How Anti-Sprawl Policy Threatens the Quality of Life.”
Photograph: Downtown Detroit (by author)
----------------------
Note 1: "Historical core municipalities," which are defined here. One such city is designated in each metropolitan area, except in Minneapolis-St. Paul and San Francisco-Oakland. In each of the metropolitan areas, these are the core cities of the metropolitan area at the beginning of the great automobile-oriented suburban expansion. These cities represent at least the urban core. However, in most cases, these cities include considerable post-war suburban development is not genuinely urban core, largely due to post-1950 annexations.
Note 2: The data in this analysis is extracted from the American Community Survey for 2010 and the United States Census of 2000. The metropolitan areas for both years are as geographically defined in 2010. The total population figures are the population for which poverty status has was determined by the Bureau of the Census (in each year this was approximately 98 percent of the total population).
Note 3: The city of Louisville reached its population peak of 390,000 in 1960. Its highest density was nearly 9,300 per square mile (3,600 per square kilometer) in 1950, when it had a population of 370,000 in 40 square miles (100 square kilometers). The suburban incorporating consolidation of 2000 left the city with under 600,000 population in 340 square miles and a population density of 1,700 per square mile (700 per square kilometer), one of the lowest core city population densities in the nation.
Note 4: The Brookings Institution report compared its "primary cities" to suburbs for 95 metropolitan areas. The primary cities included some that were little more than small towns at the beginning of the great automobile oriented suburban expansion, such as Aurora (Denver), Mesa (Phoenix), Santa Ana (Los Angeles), Fremont (San Francisco-Oakland) and Arlington (Dallas-Fort Worth), which is not served by mass transit. Each of these municipalities is classified as suburban in this analysis.


Hi everyone! New guy here
So this is my first post, and I'm just checking out all these interesting articles. Even though I'm Canadian, both of my co-hometowns I love dearly (Toronto and Vancouver) are experiencing condominium growth similar to US cities at alarming rates. Having worked in nonprofit SRO (single room occupancy) YWCA housing for a while, I'm really worried. Not only has the 'Y' had to get out of the way for Trump Tower condos, but other residential hotels (to be fair, these hotels were built around 1910, have one washroom per floor, have bugs everywhere, are notorious for drugs, prostitution and violence...my point being there must be a 2012 approach to this).
I'm saying this because a friend of mine listened to a piece on NPR concerning housing in NYC. The jist of the discussion, as he explained, was a new update to yesterday's YM/YWCA rooms and old hotel flophouses: modern, bright, airy, but very small single rooms with a washroom. As described, these units are similar in size to two parking spaces. I'm assuming the size of a motor home or a sleeper room on Amtrak, where the fridge is built in like the cabinets; same goes for tables, shelves, drawers, oven and the washroom consists of a sink, toilet, and shower where you straddle the toilet, which serves as the shower drain. The bed either is a Murphy bed or doubles as a sofa, or is similar to a bunk bed, with the bed on top, and underneath is a workspace with a computer desk and connection port for Internet and tv. These are extremely tight units - so much so that hording would be impossible because these units only include the bare necessities, just very well thought out and packed in.
I've been searching for floor plans on this because I'm really intrigued. I want this in downtown Vancouver and Toronto, where rents would be very low, and those working low wage jobs could walk to work. This new housing setup is all backwards with the uber-wealthy living downtown (many of these people don't work, or if they do, they have so much money that a 30 minute commute by car wouldn't even put a dent in their expenses. Single, very low-income adults without kids have no advocacy, but it makes the most sense to keep them downtown, because it motivates them to stay employed as they can walk to work (a bus pass can cost upwards of $110 a month), they can walk to community centres and grocery stores, and that pressure for needing a car is gone.
Anyway I've been trying to check out NPR's site for this NYC tiny-apartment proposal and am not seeing it. Is anyone familiar with this report or idea? Please let me know; thank you!
JL
Micro Flats
JR:
The NYC program has just been announced as a contest by the mayor. However, this article has a sample floorplan....
http://www.nydailynews.com/new-york/mike-pushes-smaller-apts-young-singl...
There are also micro flats in downtown Vancouver, according to this article.
http://www.cbc.ca/news/canada/british-columbia/story/2011/12/19/bc-tiny-...
Don't be surprised, however, if the rents are so high that they surprise you. Good luck.
Best regards,
Wendell Cox
Demographia
www.demographia.com