The Economist confuses ends (objectives) and means in its current number examining the peaking of per capita automobile use in the West in two articles ("The http://www.economist.com/node/21563327" and "Seeing the Back of the Car"). In congratulating metropolitan areas for trying "to change the way people move around," The Economist reminds that Portland (Oregon) has developed light rail and that policy supports transit in Los Angeles. So much for the means, but what about the ends?
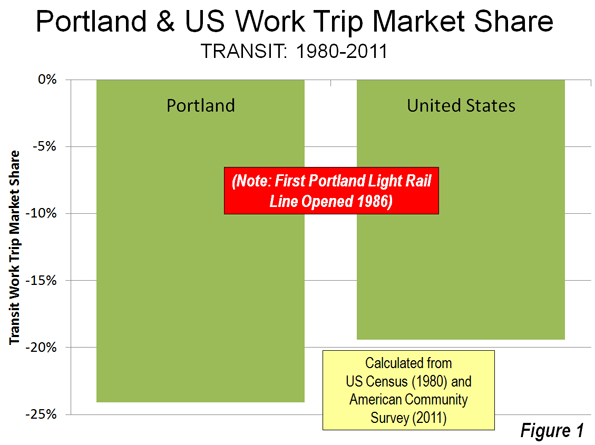
In Portland: Transit Loses Ground and a Skeptical Public: Portland, for example, has had anything but stellar performance. Transit has not kept up with growth, having lost 25 percent of its commuting (work trip) share since before the first light rail line was opened in 1986 (Note 1). With five new light rail lines, transit in Portland not only fell short of attracting its previous bus only share of commutes, but also sustained losses greater than the national rate (Figure 1).

The people of the Portland area may not share The Economist's ardor. Just last week, The Oregonian headlined "Clackamas County anti-rail measure passes comfortably; effect could resonate for decades," reporting on a 60-40 vote to require referenda for future rail expenditures. As if that were not enough, a similar measure passed by a similar margin in King City, a municipality in Washington County and Tigard, one of the area's largest municipalities, has placed the matter on the November ballot.
But Portland does have a substantial success missed by The Economist. Working at home is growing rapidly. From 1980 to 2011, working at home (mostly telecommuting) increased by 55,000. This is more than three times the growth in rail transit commuting (17,500). During the last decade, working at home passed transit as a work access mode in Portland, and with virtually no public expenditures (as opposed to the billions for new rail lines). There has been a 375,000 increase in car use by one-way commuters since 1980, and, not surprisingly, a quadrupling of excess travel time in peak period traffic (based upon Texas Transportation Institute data). In the end, Portland built an extensive rail system and the riders have not come. Portland didn't expand its highway system, and they came anyway (National 2010-2011 journey to work data is summarized here.).
In Los Angeles: Long on Rail Lines, Short on Passengers: The Economist rightly points out that Los Angeles has implemented policies to get people out of cars. Indeed, Los Angeles has been the poster child for transit development. In little more than two decades, 11 metro, light rail, and suburban rail lines have been opened. Probably no metropolitan area in the world has opened more miles of new rail service in that period. Matthew Yglesias, writing in Slate was so impressed that he called Los Angeles "America's next great mass transit city."
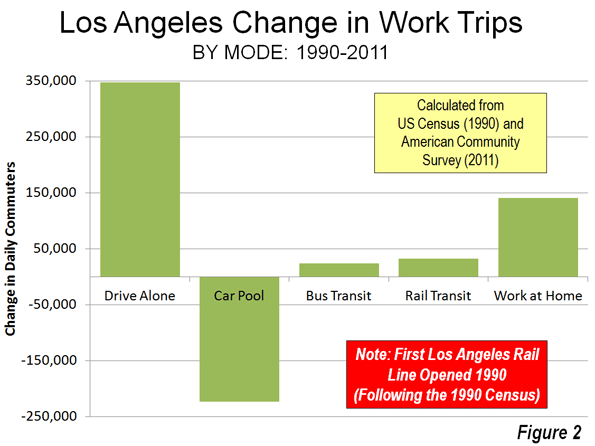
The results are less convincing. The total daily one-way commutes on the 11 rail lines is only 32,000, smaller than the number of people carried daily on a single lane of the San Diego Freeway (I-405) where it crosses over Wilshire Boulevard. Meanwhile, working at home has risen more than four times that of rail commuting since 1990 (Figure 2). Los Angeles may be better described as “America's next great telecommuting city." However, the auto is still king. From 1990 to 2011, solo automobile commuting increased 340,000, two percentage point gain, three times that of transit.

Younger People: Driving More to Work and Telecommuting More
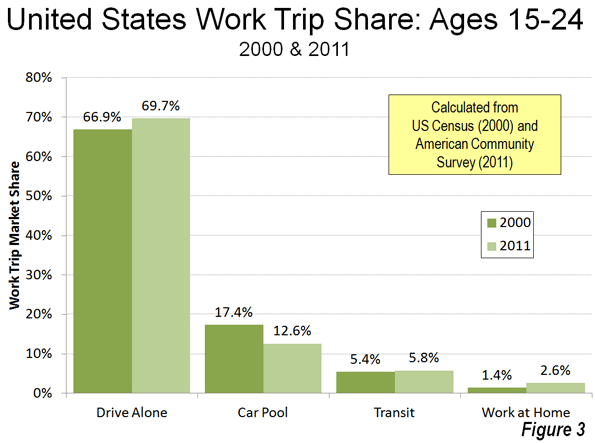
The Economist also jumps on the "young people forsaking driving" bandwagon, a subject that has attracted the attention of others. But, young people are driving more, at least to work. Since 2000, the increase in driving alone to work by people aged 15 to 24 was nearly 260,000, compared to a 4,000 loss in transit commuting. Working at home was up almost as much as driving, at 200,000. Even so, with the declining size of the younger work force, transit's share was up. From 2000 to 2011, the share of 15-24 year old workers rose from 5.4 percent to 5.8 percent (Figure 3), virtually the same as the overall increase in transit market share of from 4.6 percent to 5.0 percent (Note 2). As with Portland and Los Angeles, the last 11 years saw a much larger increase in working at home, from 3.3 percent to 4.3 percent.

Further, to the extent working at home, social media and online shopping replace the need for driving among younger adults (and everyone), all the better.
The Fantastical Claim: 50,000 Passengers Per Hour
The Economist repeats the specious claim that rail lines can carry 50,000 passengers per hour in each direction. If your world is limited to Paris between Chatelet and Gare de Lyon and the handful of similar places, maybe so. But in most of the rest of the world, it is the stuff of fairy tales.
The 2011 data shows the extent of the illusion. The fantastical rail line carrying 50,000 per hour would carry the equal of all the daily rail commuters in Dallas or Miami in less than 20 minutes. It would take only about five minutes to handle the daily rail transit commuting volume in Minneapolis or Salt Lake City.
Further, some of the new systems have been manifestly unsuccessful in attracting commuters. For example, in Charlotte, there was a strong increase in transit commuting between 2000 and 2011, with transit's market share rising 64 percent. Yet, more than 60 percent of the new commuters were on buses, rather than on light rail, reflecting a long overdue increase in artificially low service levels. In Phoenix, 85 percent of the transit commuting increase was on buses, rather than the light rail line. The fantastical 50,000 per hour line would take only handle this load in about two minutes.
Where Rail Works and Why
None of this is to suggest that rail transit does not have its place. As I pointed out in a Hong Kong Apple Daily commentary, rail transit makes all the sense in the world where appropriate (see: "Hong Kong's Rail Expansion: Avoiding Western Pitfalls"). Appropriate circumstances include huge central business districts with high employment density and radial rail transit service from throughout the metropolitan area. American Community Survey data indicates that just six municipalities (not metropolitan areas) account for 93 percent of the nation's rail commuting destinations. The city of New York, alone is the destination of 65 percent of national rail commuters. Another 28 percent commute to the cities of Chicago, Philadelphia, Washington, Boston and San Francisco. Within these six cities, the overwhelming share of transit commuting is to the downtowns (central business districts), which, combined, cover a land area less than half the size of Orlando's Disney World.
Why Driving Has Peaked
Alan Pisarski told us in 1999 "(Cars, Women and Minorities: The Democratization of Mobility in America") that the demand for driving would soon peak. Women were driving nearly as much as men and cars were becoming the dominant mode of transport for low income people. Cars already carry the overwhelming majority of low-income commuters. A "love affair with the automobile" mentality misled many who should have known better into believing that people would eventually drive 24 hours per day. In fact, the huge increase in driving to the 2000s was more about democratizing mobility and access, and as the Washington Times recently put it, prosperity (see "A world without cars:
The internal-combustion engine has freed mankind"). If home-based access can take up the slack, it would do more for the environment and people’s lives than all the expensive, largely ineffective rail system imagined by the media and the well-financed rail lobby.
------
Note 1: The data in this article is largely taken from the journey to work reports of the US Census (1980, 1990 and 2000) and the American Community Survey (one year data 2011).
Note 2: The overall 5.0 percent transit market share figure may be high. The USDOT National Household Travel Survey (NHTS) indicates that people who commute by transit tend to use other modes (such as automobiles) often. NHTS data indicates that, overall transit accounted for 3.7 percent of commuters and an even lower 2.7% of commuting miles in 2009.
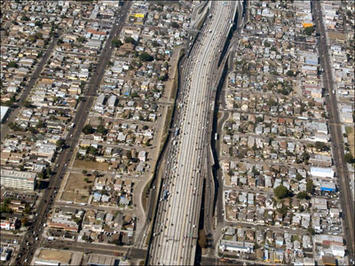
Photo: Harbor Freeway (I-110), Los Angeles (by author)


Employment density is key
Among the many vital pieces of data that utopian urban planners and "transport planners" seem to have missed the significance of, is "employment density".
This statistic alone should make it obvious whether a city is suited to mass transit "investments" or not.
What the heck DO they TEACH these people in "planning school"?
Furthermore, it would be nonsense to expect to be able to change "employment density" in every city, in the general direction of Manhattan. Would we expect farmers to use skyscrapers?
News flash for urban planners: industry types consist of a broad spectrum of appropriate levels of land use, ranging from farming at one extreme, to global finance at the other. It is only slightly less ridiculous to expect all URBAN industries to work at "global finance sector" densities, as it would be to expect farming and forestry to do so.