
The global financial crisis has drawn greater attention to the world of the super rich and to the astounding increases in inequality since 1980, returning the country to a degree of inequality last seen in 1929 or perhaps even 1913. In the year 2006 alone, Wall Street executives received bonuses of $62 billion. Financial services increased from 10 percent of all business profits in 1980 to 40 percent in 2007, an obscene and indefensible development that now threatens the rest of the ‘real economy’.
Here’s what happened to income and wealth between 1970 and 2005
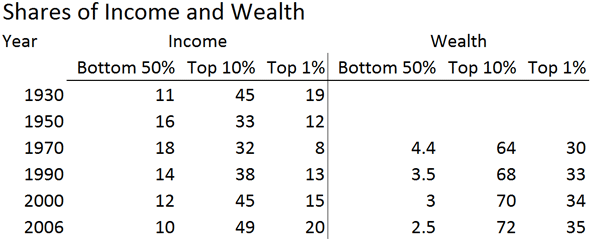
These figures reveal an inexorably growing concentration of income and wealth, which has taken place under both Democratic and Republican regimes. Conversely, given inflation over the last 35 years, lower and middle classes receive smaller shares. Only the affluent - the top 10% - and the rich – the top 1% - have gained ground.
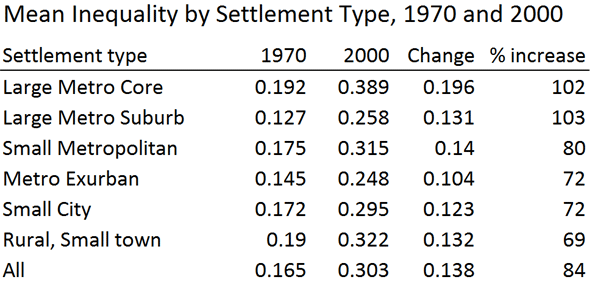
This pattern of inequality also has a geography with variations across the country between different places (here counties). Generally between 1970 and 2000 the greatest inequality has developed in the largest metropolitan regions and their suburbs.
Large metropolitan core counties are by far the most likely to have higher inequality. In contrast other geographies have much lower inequality, with small metropolitan, small city and rural counties near the national average. In other words, core metropolitan counties are skewed toward greater inequality (higher shares of very rich and of very poor), while suburban and exurban areas generally exhibit lower inequality (values bunched centrally, with fewer extremely rich or poor households).
Overall the greatest inequality lies in the very largest metropolitan cores (Los Angeles, Chicago, New York, Houston, etc), areas with large racial or ethnic minorities (e.g., in FL, TX, CA and much of the South), as well as in selected large northeastern metropolises (suburb as well as core, as in Chicago, Cleveland, Pittsburgh, New York, Philadelphia, and Washington DC) and across the southern half of the country more generally. Lower inequality occurs mainly in suburban or small metropolitan counties, and mainly in the north.
Among smaller metropolitan (< 50,000 households) and non-metropolitan counties there emerges a truly dramatic north-south cleavage just around the Iowa border and along the Ohio River divide. A more mixed pattern prevails in the west and in the northeast, where intermediate levels of inequality are common. Especially high rates of inequality characterize racial and ethnic minority areas and Appalachia, as could be expected, but also many environmental amenity areas, especially in the west. Low inequality is fairly extensive in the hinterlands of selected Great Lakes and upper Midwest metropolises, like Omaha, Minneapolis and Chicago.
Generally more egalitarian areas boast higher incomes, female labor force participation, more shares in manufacturing, greater incidence of husband-wife families, of whites, of home ownership, but lower percentages of government and service jobs, fewer residents with less than a 9th grade education, people 18-24, singles, single parent families, and less Blacks and Hispanics.
High levels of inequality are generally the opposite of the egalitarian areas: more minorities, single parent families, less manufacturing and dependence on government as well as service sector jobs.
Inequality varies by both kinds of settlement geography and by the social and economic character of areas. The most obvious and visible attributes that signify greater inequality are social characteristics: racial and ethnic minorities, low levels of education, low proportions of traditional husband-wife families (partly because of fewer earners), and high dependency (many of the very young and very old).
Unequal places tend to be those with low concentrations of manufacturing and higher shares of both managerial-professional occupations and service jobs. Geographic impacts vary. Most rural, newer suburban and exurban areas tend to have lower inequality because they tend to maintain middle income homogeneity. Yet rural areas that are isolated and have weak economies, like Appalachia, suffer high inequality. Large metropolitan areas with the highest inequality also tend to have large concentrations of racial minorities and of non-families, especially young singles
Overall it is clear that inequality has been on the rise since 1970. This was a time when the nation was prosperous, manufacturing was strong, as were unions, income taxes fairly progressive, while “war on poverty” legislation had helped those at the bottom, the baby boom was still on and families dominant.
But if the extent of inequality has grown, its geography has changed far less. Large metropolitan cores had the highest inequality in 1970 and 2000, and metropolitan suburbs and exurbs the lowest, with small cities in between. Yet inequality grew fastest in large metropolitan cores and suburbs. Small metropolitan areas (many were small cities in 1970) had the next highest increase (80 percent) and rural small town areas the lowest (69 percent).
Sadly, only a few counties had decreases in inequality. Many were military base counties, mainly in the south. Another group of counties with lower inequality are new suburban counties, which have become more uniformly middle class as a result of significant urban growth, mainly in the South with more rapid urban and industrial growth.
Overall, the change in inequality between 1970 and 2000 was substantial and wide ranging. The causes for this tend to be national and structural, including deindustrialization, the rise of a service economy, the decline of the traditional family and tax changes favoring the very wealthy. Areas that traditionally were most unequal – notably the great global cities – have simply become more so.
It is here, in the command and communication centers of the economy, that the greatest wealth has been accumulated and where we can see the rise of a new aristocracy nevertheless dependent on a large low wage service class. The next Administration and Congress should start to address these trends or the traditional American dream will become, for most citizens, no more than that.
Richard Morrill is Professor Emeritus of Geography and Environmental Studies, University of Washington. His research interests include: political geography (voting behavior, redistricting, local governance), population/demography/settlement/migration, urban geography and planning, urban transportation (i.e., old fashioned generalist)


Thanks for posting this
Thanks for posting this info. I just want to let you know that I just check out your site and I find it very interesting and informative. I can't wait to read lots of your posts.
read my review
I am very enjoyed for this
I am very enjoyed for this blog. Its an informative topic. It help me very much to solve some problems. Its opportunity are so fantastic and working style so speedy.
avs service
Great post, and great
Great post, and great website. Thanks for the information!
Read More about Rune at Blog