
The continuing dispersion of employment in the nation's major metropolitan areas has received attention in two recent reports. The Brookings Institution has published research showing that employment dispersion continued between 2000 and 2010, finding job growth was greater outside a three mile radius from central business districts between 2000 and 2010 in 100 metropolitan areas Note 1). This assessment probably underestimates the extent of job dispersion, since it includes some suburban centers as central business districts (such as West Palm Beach, FL and Palo Alto, CA).
Recently I showed that employment dispersion has reached a point that there is a virtual balance of jobs and housing in suburban areas, which contrasts with the continuing excess of jobs in core municipalities relative to resident workers. After that article was published, Richard L. Forstall forwarded me research he presented to the Southern Demographic Association in the 1990s that examined employment trends in core municipalities and suburban areas between 1960 and 1990. At the time, Forstall was at the United States Bureau of the Census. He also spent years supervising Rand McNally international metropolitan area population estimates (Note 2).
Major Metropolitan Job Dispersion: 1950 to 2010 and
Forstall provides detailed information for the 35 major metropolitan areas as of 1990 (over 1,000,000 population). This article augments the Forstall research with data from the 2010 census (Note 3).
Consistent with both national and international trends, the half century between 1960 and 2010 indicated significant dispersion in metropolitan areas. This, of course, was a continuation of a trend that accelerated from the first quarter of the 19th century, when early mass transit systems allowed people to live in larger spaces, farther away from their work.
The movement of residents from the urban core to the suburbs followed the even greater exodus from small towns and rural areas. But it was not long before residents of the homogeneous bedroom suburbs of the 1950s began to find more nearby employment opportunities.
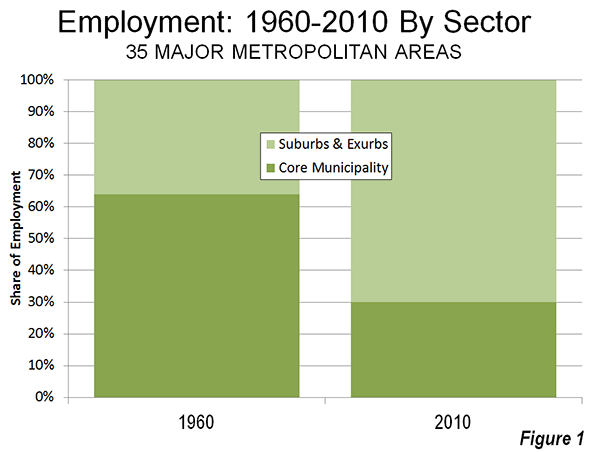
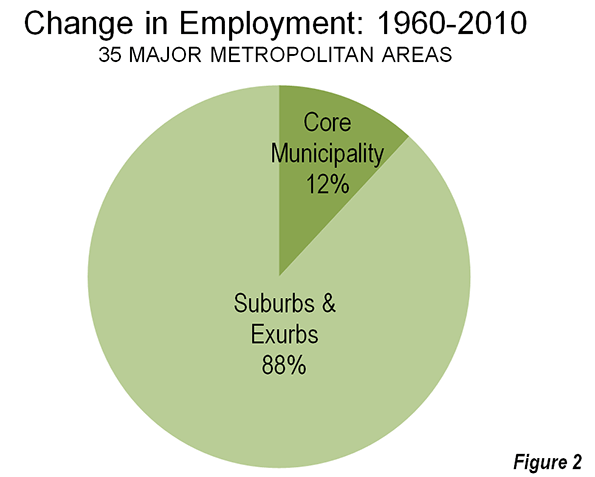
In 1960, 54% of the employment in the 35 major metropolitan areas was in the historical core municipalities, with the balance of 46% of the jobs in suburban and exurban areas. By 2010, the corner municipality share had dropped to 30%, while suburban and exurban areas contained 70% of the employment (Figure 1). Between 1960 and 2010, 88% of the new jobs were in the suburbs and exurbs, leaving only 12% of the growth in the core municipalities (Figure 2).
Dispersion Greater in Metropolitan Areas with Pre-War Non-Suburban Cores
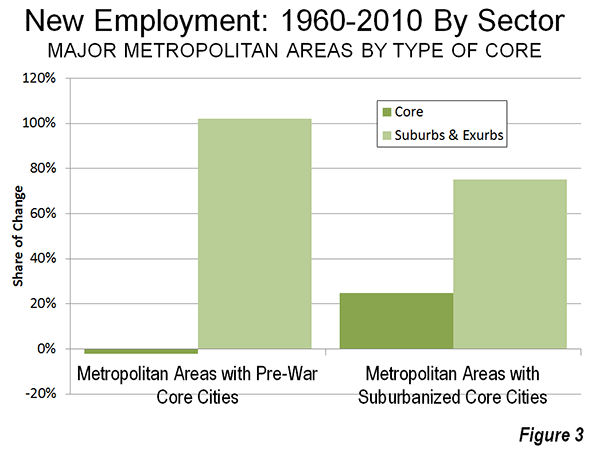
However, even this distribution appears to mask an even greater dispersion. Among the metropolitan areas with "Pre-war non-suburban core municipalities," (such as San Francisco, Baltimore, Providence, New York, etc.) a full 102% of job growth was in suburban and exurban areas. Core city employment accounted for a minus two percent of employment growth (in other words, it declined). These are metropolitan areas with core cities that were virtually fully developed before World War II and which have added little to their land areas by annexation.
The other metropolitan areas have core cities with large swaths of suburbanization and some, like Phoenix and Sacramento are virtually all suburban. In these metropolitan areas, approximately 25% of the job growth since 1960 has been in the core cities (Figure 3).
Pre-War Non-Suburban Core Municipalities Losses and Gains
Among the 18 metropolitan areas with "Prewar non-suburban" core municipalities, two thirds experienced losses in their core cities. The Rust Belt "ground zero" core cities of Detroit, Cleveland, and Buffalo all lost 40 percent or more of their employment, and were joined by second tier Rust Belter St. Louis. The core city of Pittsburgh, typically one of the Rust Belt's big four, did much better, losing only five percent of its employment. Across the state, however, the core city of Philadelphia did much worse, dropping 23 percent of its employment. The core city of Chicago lost 20 percent of its employment.
Perhaps most notable was the core city of Hartford, which lost 9 percent of its employment between 1960 and 2010. According to data in the Brookings Institution Global Metro Monitor, Hartford has emerged as the world's most affluent major metropolitan area (measured by gross domestic product per capita) over the same period. All of Hartford's job growth was in the suburbs and exurbs.
The core city of New York did the best among the metropolitan areas with "Pre-War non-suburban" cores, attracting 16 percent of the employment growth over the half-century. Washington (DC) also did well, with a 12 percent share of new employment.
Urban Dispersion and the Quality of Life
The dispersed metropolitan area, along with its comprehensive roadway networks, has served the US well, especially in two important measures of the quality of life --- housing affordability and mobility. Major metropolitan areas in the United States have some of the most affordable housing in the high-income world. The US has shorter work trip travel times than Canada or Western Europe and much shorter than the major metropolitan areas of Japan (with the most comprehensive rail systems in the world) and East Asia.
This advantage was reiterated with the recent release of the Tom Tom Congestion Index, which showed traffic congestion in the metropolitan areas of Australia and New Zealand to be far worse than in US metropolitan areas of similar size. For example, Sydney is as congested as Los Angeles, despite having only one-third the population. Auckland (New Zealand) has worse traffic congestion than any US metropolitan area of similar size.
Peter Gordon and Harry W. Richardson spotted this advantage nearly two decades ago (See Are Compact Cities a Desirable Planning Goal?), before there was international traffic congestion comparison data. Based upon their review of national travel surveys, they concluded:
Suburbanization has been the dominant and successful mechanism for reducing congestion. It has shifted road and highway demand to less congested routes and away from core areas.
Wendell Cox is a Visiting Professor, Conservatoire National des Arts et Metiers, Paris and the author of “War on the Dream: How Anti-Sprawl Policy Threatens the Quality of Life.
-------
Note 1: The Brookings Institution report indicates that employment within a 3 mile radius of downtown (the central business district) increased in number and share only in the Washington, DC metropolitan area. However, this may not indicate an increase in central business district (downtown) employment. The large, nearby, but suburban employment centers of Rosslyn, Crystal City and downtown Alexandria may be located within the three mile radius (the report does not indicate the point from which the radius is drawn). The three mile radius used in the report is useful and represents the best reported data. However, it may not be representative of central business district employment encloses a huge area (28 square miles), which is more than 25 times the typical central business district geographical size and larger than the land areas of the core cities of Providence and Hartford and nearly two-thirds the size of the core city of San Francisco. Transit commuting to such nearby employment centers is routinely far lower than the share that ride transit to downtown.
Note 2: Forstall is co-author (with Richard P. Greene and James B. Pick of seminal research that estimated the population densities of the largest metropolitan areas in the world (Which Are the Largest: Why Lists of Metropolitan Areas Vary So Greatly). Normally, metropolitan area densities cannot be validly compared because of widely varying criteria between nations. Further, in the United States, metropolitan area densities are nonsensical, because their building blocks vary in size too much. With its County-based definitions, US metropolitan areas include building blocks ranging from half the size of Orlando's Walt Disney World (New York County, or Manhattan borough) to the size of the nation of Costa Rica (San Bernardino County). The use of such a crude building block results in the inclusion of huge amounts of rural territory that is outside the labor market or the commuting shed (metropolitan areas are typically defined as labor markets). Forstall and his coauthors applied criteria that was both consistent and rational. This exhaustive process limited the number of metropolitan areas for which they were able to make estimates to 28.
Note 3: This analysis differs from Forstall's approach in defining core cities using the historical core municipality classification. It should be noted that there have been changes in metropolitan definitions over the 50 years.
Photo: Suburban employment in Chicago (by author)


Job Problems
Due to economical crisis we have found a huge recession arise in various nations. As a result several job seekers are liable to search or lose their job; which brings depression among them. But in most of the regions we have found that job sectors are rapidly increases to provide better job options to people in their preferred sections.
US urban-econ diversity is THE working model to emulate
The “powers that be” who assure us that “intensification” will provide “housing affordability” are either so ignorant or corrupt that they should not be allowed within miles of levers of power that have any influence on social outcomes, let alone outcomes as significant as those affected by housing.
How many times does it have to be pointed out to these people, that the correlation in data sets of real life cities all over the world, is between low density and affordability, and high density and unaffordability. Every city in the annual Demographia Reports that has had a median multiple house price stable for years at around three, is a low density city. Almost all the cities that cluster around the median multiple levels of six and higher (and with price volatility as well), are high density cities, and all of them without exception have “planning” that restricts the conversion of rural land to urban. All of them without exception have land prices per square foot rising faster than home buyers can “trade down” in section size to compensate.
To add insult to injury, there is no correlation between efficiency of “commute to work time” and higher density, which is the most common shallow assumption in the minds of those who favour a “more compact city”. Doubling the density of housing only reduces travel distances about 7% in real life because most of the space is taken up with things other than “housing”. But traffic congestion is always nearly doubled along with the 7% reduction in travel distances (“mode shift” always being single-digit percentages) and the tipping of more and more roads from free-flowing to “stop-start” conditions causes travel speeds to plummet and exhaust emissions to increase.
Melia, Pankhurst and Barton, “The Paradox of Intensification” (2011) is a promising sign that UK academics are FINALLY starting to "get it". Pity the UK economy is a dead man walking long since, and what is more, completely unreformable (the reason for this is a subject for an essay in its own right).
The USA's "free to sprawl" cities are and always have been a massive net ADVANTAGE to the US economy as a whole. The UK economy is the perfect working (non-working, actually) model of the alternative. It is a measure of the post-reason nature of the "smart growth" crusaders in the US and Canada and Australasia, that this is totally ignored.
defining labor sheds
While true that some MSA's include large amounts of rural area, the best measure for defining labor markets is commuting flows and this is excactly how they are determined. Some areas you can travel 40 miles in what it takes to get 5 miles in other places, and you can travel those same 40 miles under much less stress as well.