
The US Census Bureau recently released poverty rate data by state, county and metropolitan area for 2012. As has been the case for decades, urban core poverty rates dwarf those of suburban areas in the nation's 52 major metropolitan areas (those with more than 1 million population).
Urban Core & Suburban Poverty Rates
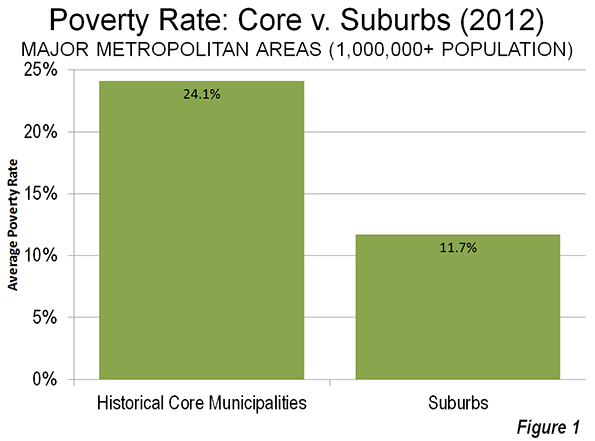
The average poverty rate in the 52 urban cores – the historical core municipalities – was 24.1 percent, more than double the 11.7 percent rate in suburban areas (Figure 1). These high poverty rates have continued despite the best decade in more than one-half century for the urban cores which have experienced net population increases in the neighborhoods within two miles of downtown. The heavy urban core losses of the 1960s through the 1980s are generally no longer occurring. Yet, between 2000 and 2010, more than 80 percent of the population growth in the urban cores was below the poverty line (See City Growth Mainly Below Poverty Line). By contrast, less than one third of the suburban population increase was below the poverty line.
| Table 1 | |||
| Major Metropolitan Areas: Summary of Poverty Status: 2012 | |||
| Historical Core Municipalities (HCM) | Suburbs | Metropolitan Area | |
| Population (Poverty Status Determined) | 44,730,920 | 123,763,495 | 168,494,415 |
| Above Poverty Level | 34,613,515 | 108,917,367 | 143,530,882 |
| Below Poverty Level | 10,117,405 | 14,846,128 | 24,963,533 |
| Major Metropolitan Areas | 22.6% | 12.0% | 14.8% |
| Data from American Community Survey, 2012 | |||
Detailed Metropolitan Data
The lowest historical core municipality poverty rate was in San Jose, at 13.0 percent. Seattle, San Diego, Raleigh and San Francisco rounded out the five urban cores with the lowest poverty rates. The highest urban core poverty rate was in Detroit, at 42.8 percent, followed by Hartford, Cleveland, Cincinnati and Miami.
The lowest suburban poverty rate was in the Washington metropolitan area at 7.2 percent. Milwaukee, Baltimore, Indianapolis and Minneapolis-St. Paul followed. The highest suburban poverty rate was in the Riverside San Bernardino, 18.4 percent, followed by Orlando, Miami, Las Vegas and Atlanta. Only 15 of the major metropolitan areas had suburban poverty rates that were higher than the best historical core municipality rate of 13.0 percent (San Jose).
Taking a look over the regions of the country, the five lowest major metropolitan poverty rates were in Washington (8.4 percent), Boston, Minneapolis-St. Paul, San Jose, and Hartford. The highest major metropolitan area poverty rates were in Memphis (19.9 percent), New Orleans, Riverside San Bernardino, Los Angeles, and Miami (Table 2).
A caveat is in order, however. The official poverty rate does not take into consideration the cost of living differences between states and metropolitan areas. These differences can be large. According to the latest Bureau of Economic Analysis (US Department of Commerce) data, there can be an up to 35 percent difference in the cost of living between major metropolitan areas (the high being San Francisco and the lowest being St. Louis). The new Census Bureau supplemental poverty measure takes housing costs into consideration, but provides only state data. The differences can be substantial. For example, California’s supplemental poverty rate is the highest in the nation, and nearly one-half higher than its unadjusted poverty rate. California’s housing adjusted poverty rate is approximately double that of West Virginia, which is normally considered to be one of the nation’s highest poverty states.
| Table 2 | ||||||||
| Major Metropolitan Areas: Poverty Status: 2012 | ||||||||
| Metropolitan Area | Historical Core Municipalities (HCM) | Rank | Suburbs | Rank | Metropolitan Area | Rank | Core Rate/ Suburban Ratio | Rank |
| Atlanta, GA | 25.8% | 35 | 15.8% | 48 | 16.6% | 41 | 1.63 | 14 |
| Austin, TX | 20.3% | 14 | 11.5% | 28 | 15.5% | 31 | 1.77 | 19 |
| Baltimore, MD | 24.8% | 34 | 7.4% | 3 | 11.3% | 6 | 3.34 | 49 |
| Birmingham, AL | 31.2% | 46 | 13.5% | 41 | 16.8% | 42 | 2.31 | 34 |
| Boston, MA-NH | 21.6% | 21 | 9.0% | 9 | 10.7% | 2 | 2.40 | 38 |
| Buffalo, NY | 30.9% | 44 | 9.4% | 11 | 14.2% | 19 | 3.30 | 47 |
| Charlotte, NC-SC | 21.8% | 23 | 9.9% | 14 | 15.1% | 30 | 2.22 | 33 |
| Chicago, IL-IN-WI | 23.9% | 30 | 10.8% | 22 | 14.5% | 24 | 2.20 | 32 |
| Cincinnati, OH-KY-IN | 34.1% | 49 | 11.9% | 32 | 14.9% | 26 | 2.86 | 41 |
| Cleveland, OH | 36.1% | 50 | 10.8% | 21 | 15.6% | 32 | 3.33 | 48 |
| Columbus, OH | 21.8% | 23 | 9.9% | 15 | 15.1% | 29 | 2.20 | 31 |
| Dallas-Fort Worth, TX | 23.9% | 31 | 13.0% | 38 | 15.0% | 27 | 1.85 | 22 |
| Denver, CO | 19.2% | 10 | 10.7% | 19 | 12.7% | 12 | 1.80 | 21 |
| Detroit, MI | 42.3% | 52 | 12.6% | 35 | 17.4% | 47 | 3.36 | 50 |
| Grand Rapids | 29.4% | 42 | 12.4% | 34 | 16.5% | 40 | 2.37 | 36 |
| Hartford, CT | 38.0% | 51 | 7.9% | 6 | 10.9% | 5 | 4.83 | 52 |
| Houston, TX | 23.5% | 29 | 12.6% | 36 | 16.4% | 39 | 1.87 | 24 |
| Indianapolis. IN | 22.2% | 25 | 7.6% | 4 | 14.4% | 22 | 2.92 | 43 |
| Jacksonville, FL | 18.5% | 9 | 11.4% | 27 | 15.7% | 33 | 1.61 | 13 |
| Kansas City, MO-KS | 20.7% | 15 | 10.6% | 18 | 12.9% | 14 | 1.94 | 28 |
| Las Vegas, NV | 17.6% | 6 | 15.8% | 49 | 16.4% | 37 | 1.11 | 2 |
| Los Angeles, CA | 23.3% | 27 | 15.3% | 45 | 17.6% | 49 | 1.53 | 9 |
| Louisville, KY-IN | 19.5% | 12 | 13.1% | 40 | 16.1% | 35 | 1.49 | 6 |
| Memphis, TN-MS-AR | 28.3% | 38 | 11.8% | 31 | 19.9% | 52 | 2.39 | 37 |
| Miami, FL | 31.7% | 48 | 16.4% | 50 | 17.5% | 48 | 1.94 | 27 |
| Milwaukee,WI | 29.9% | 43 | 7.3% | 2 | 15.9% | 34 | 4.08 | 51 |
| Minneapolis-St. Paul, MN-WI | 22.6% | 26 | 7.7% | 5 | 10.7% | 3 | 2.94 | 44 |
| Nashville, TN | 19.4% | 11 | 11.2% | 25 | 14.3% | 20 | 1.73 | 16 |
| New Orleans. LA | 28.7% | 40 | 15.4% | 47 | 19.4% | 51 | 1.87 | 23 |
| New York, NY-NJ-PA | 21.2% | 19 | 9.8% | 12 | 14.8% | 25 | 2.17 | 30 |
| Oklahoma City, OK | 19.7% | 13 | 13.1% | 39 | 16.2% | 36 | 1.50 | 7 |
| Orlando, FL | 21.2% | 20 | 16.4% | 51 | 16.9% | 44 | 1.30 | 4 |
| Philadelphia, PA-NJ-DE-MD | 26.9% | 37 | 8.7% | 8 | 13.4% | 16 | 3.08 | 45 |
| Phoenix, AZ | 24.1% | 32 | 13.9% | 42 | 17.4% | 46 | 1.74 | 17 |
| Pittsburgh, PA | 21.1% | 16 | 10.9% | 23 | 12.1% | 10 | 1.94 | 26 |
| Portland, OR-WA | 17.7% | 7 | 12.7% | 37 | 14.0% | 18 | 1.39 | 5 |
| Providence, RI-MA | 28.7% | 39 | 11.7% | 29 | 13.6% | 17 | 2.44 | 39 |
| Raleigh, NC | 16.4% | 4 | 10.7% | 20 | 12.7% | 11 | 1.53 | 10 |
| Richmond, VA | 26.3% | 36 | 9.1% | 10 | 11.9% | 9 | 2.88 | 42 |
| Riverside-San Bernardino, CA | 31.1% | 45 | 18.4% | 52 | 19.0% | 50 | 1.68 | 15 |
| Rochester, NY | 31.6% | 47 | 10.2% | 17 | 14.4% | 23 | 3.10 | 46 |
| Sacramento, CA | 23.4% | 28 | 15.1% | 44 | 16.9% | 43 | 1.55 | 11 |
| St. Louis,, MO-IL | 29.2% | 41 | 12.4% | 33 | 14.3% | 21 | 2.35 | 35 |
| Salt Lake City, UT | 21.2% | 17 | 11.1% | 24 | 12.7% | 13 | 1.91 | 25 |
| San Antonio, TX | 21.7% | 22 | 10.0% | 16 | 17.3% | 45 | 2.17 | 29 |
| San Diego, CA | 15.5% | 3 | 14.7% | 43 | 15.0% | 28 | 1.05 | 1 |
| San Francisco-Oakland, CA | 17.3% | 5 | 9.8% | 13 | 11.9% | 8 | 1.75 | 18 |
| San Jose, CA | 13.0% | 1 | 8.5% | 7 | 10.8% | 4 | 1.52 | 8 |
| Seattle, WA | 13.6% | 2 | 11.3% | 26 | 11.7% | 7 | 1.20 | 3 |
| Tampa-St. Petersburg, FL | 24.5% | 33 | 15.3% | 46 | 16.4% | 38 | 1.61 | 12 |
| Virginia Beach-Norfolk, VA-NC | 21.2% | 18 | 11.8% | 30 | 13.1% | 15 | 1.80 | 20 |
| Washington, DC-VA-MD-WV | 18.2% | 8 | 7.2% | 1 | 8.4% | 1 | 2.52 | 40 |
| Average of Metropolitan Areas | 24.1% | 11.7% | 14.7% | 2.07 | ||||
Suburban Poverty
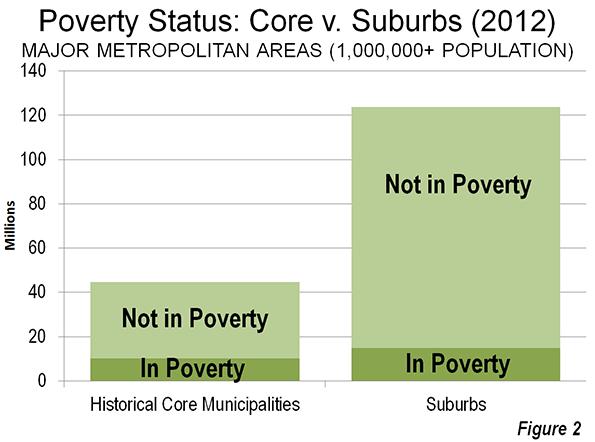
The majority of the major metropolitan area poverty population now lives in the suburbs, by virtue of their population dominance; overall suburban populations are now 2.7 times as large as those of all core cities. In fact, rather than being a new phenomenon, suburban areas passed the urban cores in poverty population before 2000. The 2000 Census indicated that approximately 53 percent of the poverty population was in suburban areas of the 52 metropolitan areas. The share of poverty rose to 59 percent in the suburbs, largely as a consequence of their having dominated growth between 2000 and 2012. While there were nearly 5 million more people below the poverty line in the suburbs than in the historical core municipalities, the suburbs contained more than three times the above-poverty line population – some 109 million – as the urban cores (Figure 2).
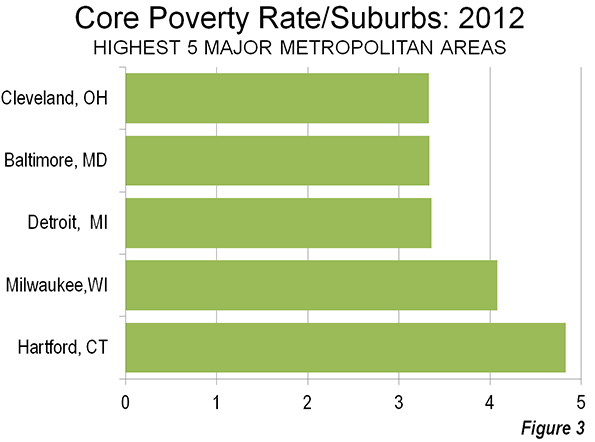
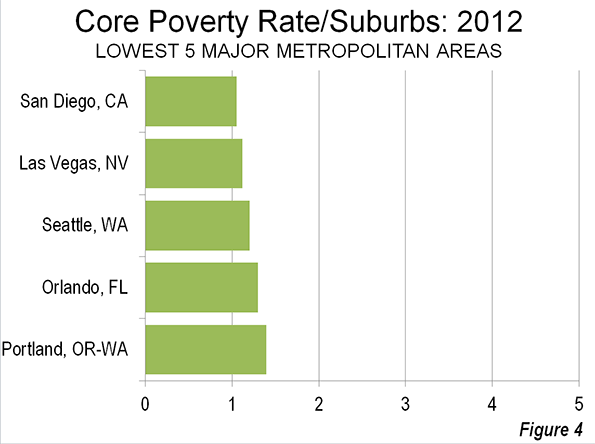
In 2012, suburban poverty rates were below those of the urban cores in all 52 major metropolitan areas (Table 2). The urban core poverty rates ranged from 5 percent above the suburban rates, in San Diego to nearly 5 times the suburban rate in Hartford. San Diego, Las Vegas, Seattle, Orlando and Portland had the lowest urban poverty rates relative to the suburbs of the same metropolitan areas (Figure 3). The urban cores of Hartford, Milwaukee, Detroit, Baltimore and Cleveland had the highest poverty rates relative to the suburbs of the same metropolitan areas (Figure 4).
Poverty by Historical Core Municipality Category
When the new poverty data was announced, Milwaukee Mayor Tom Barrett bemoaned the fact that the city's poverty rate was the highest in the nation relative to that of the suburbs. The Milwaukee Journal-Sentinel’s “Politifact” pointed out that the mayors’ contention was based on 2010 data rather than the new 2012 data. As is noted above, Hartford had displaced Milwaukee with the highest urban core poverty rate relative to the suburbs by 2012.
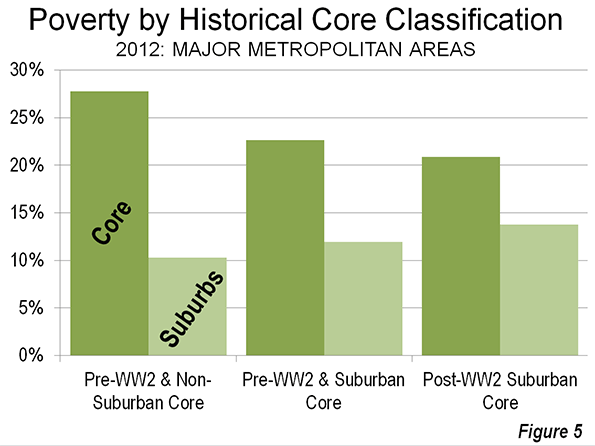
However, Mayor Barrett’s concern is well founded. The city of Milwaukee’s high poverty rate relative to the suburbs is surprising. Among the five urban cores with the highest poverty rates relative to the corresponding suburbs, only Milwaukee includes substantial areas of suburban land use development. The city of Milwaukee is categorized as a Pre-World War II core with substantial suburbanization, by virtue of having more than doubled its land area by annexing lower density (suburban) areas. Each of the four other urban cores with the highest ratios relative to suburban poverty rates are classified as pre-World War II cores with little suburbanization. None of these municipalities (Hartford, Detroit, Baltimore, and Cleveland) has annexed significant suburban territory since before World War II.
Since poverty tends to be more concentrated in urban cores in the United States, it is to be expected that pre-World War II historical core municipalities would have higher poverty rates relative to the suburbs.
The smallest differences between urban core and suburban poverty rates are found in the metropolitan areas with heavily suburban core cities and lack major pre-World War II cores (Figure 5). San Jose, Phoenix, Orlando, and Las Vegas are examples of metropolitan areas in this category.
From Poverty to Prosperity
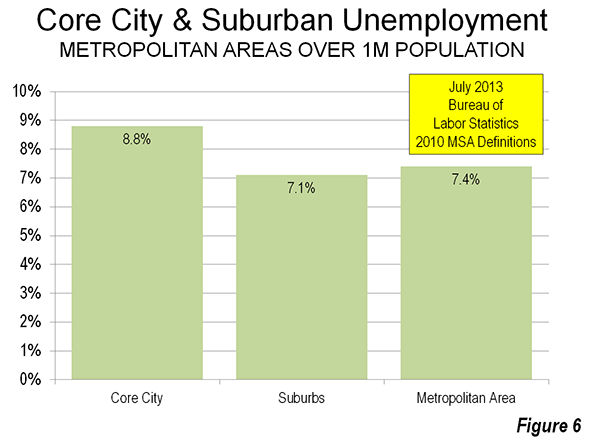
The continuing high rates of poverty in the urban cores and the higher than previous poverty rates in suburban areas is cause for primary concern. At the heart of the problem is the lingering high unemployment rate, which averages nearly a quarter higher in the urban cores than in the suburbs (Figure 6).
The principal purpose of cities (from the urban core to the exurban periphery) is to facilitate a better standard of living for all income segments. This has, of course, been made difficult by the Great Recession and could be lengthened should grudging growth nurture a long-term Great Malaise. Obviously, the answer is stronger economic growth, which will require a better investment climate
Wendell Cox is a Visiting Professor, Conservatoire National des Arts et Metiers, Paris and the author of “War on the Dream: How Anti-Sprawl Policy Threatens the Quality of Life.
-----
Note: These data vary from those reported by the Brookings Institution, which classifies “cities” and “suburbs” differently. For example, the Brookings Institution classifies suburbs such as Arlington, Texas in the Dallas-Fort Worth metropolitan area, Aurora, Colorado in Denver (see photo above), Mesa, Arizona in Phoenix, Bellevue , Washington in Seattle and Paradise, Nevada in Las Vegas as “cities.” The net effect is generally higher suburban poverty rate in the Brookings Institution analysis than in this “urban core” versus suburban analysis.
-----
Photo: Suburban Denver (Aurora), by author


What has happened to the process of gentrification?
This is a bit of a blow to my belief that urban cores inevitable direction of evolution is towards gentrification. Maybe there is a lapse in this process recently, or has there been a significant change in the importance of central location?