
There have been frequent press reports that baby boomers, those born between 1945 and 1964, are abandoning the suburbs and moving "back" to the urban cores (actually most suburban residents did not move from urban cores). Virtually without exception such stories are based on anecdotes, often gathered by reporters stationed in Manhattan, downtown San Francisco or Washington or elsewhere in urban cores around the nation. Clearly, the anecdotes about boomers who move to suburbs, exurbs, or to outside major metropolitan areas are not readily accessible (and perhaps not as interesting) to the downtown media.
Yet there is a wide gulf between the perceived reality of the media stories and what is actually occurring on the ground, as is indicated by comprehensive sources. The latest available small area data shows that baby boomers continue to leave the urban cores in large numbers. They have also left the earlier suburbs in such large numbers that their population gains in the later suburbs and exurbs have been insufficient to stem boomer movement out of the major metropolitan areas to smaller cities and rural areas.
These conclusions are drawn from an analysis of population at the zip code tabulation area (ZCTA) among those 35 to 54 years of age in 2000 and the same cohort in 2010 (then 45 to 64 years of age). This small area analysis avoids the exaggeration of urban core data that necessarily occurs from reliance on the municipal boundaries of core cities (which are themselves nearly 60 percent suburban or exurban, ranging from as little as three percent to virtually 100 percent). This is described in further detail in the "City Sector Model" note below.
Overall Trend
The national population of the baby boomer generation declined 1.82 million between 2000 and 2010, a 2.2 percent loss (the result of an inevitably increasing death rate from the aging of cohorts). A small increase of 350,000 (1.0 percent) outside the largest cities was more than offset by a 2.17 million loss in the major metropolitan areas (over 1 million population), where the decline was of 4.7 percent.
Boomers and the Urban Core
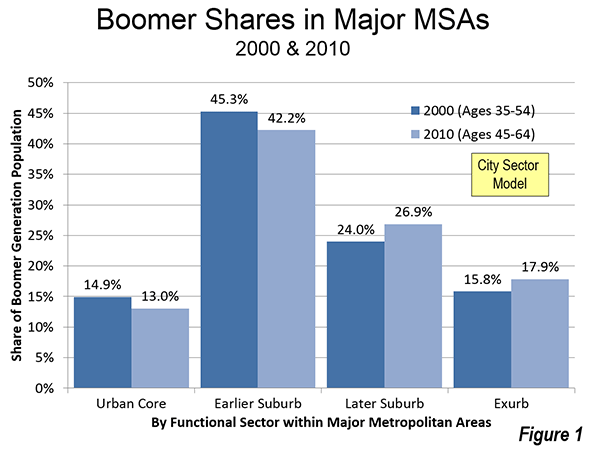
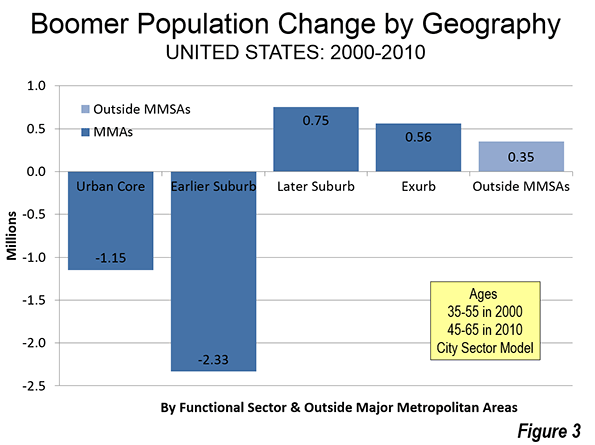
The largest percentage loss occurred in the functional urban cores, which experienced a decline of 1.15 million baby boomers, a reduction of 16.7 percent. The functional urban cores are defined by the higher population densities that predominated before 1940 and a much higher dependence on transit, walking and cycling for work trips (further details are provided in the "City Sector Model" note below). In 2000, baby boomers accounted for 14.9 percent of the major metropolitan area population, a figure that declined to 13.0 percent by 2010 (Figure 1).
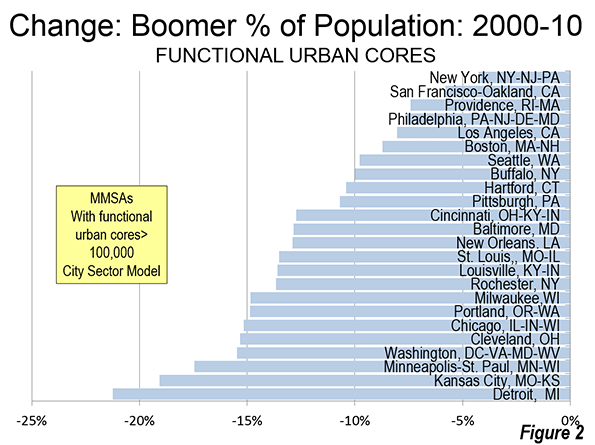
The losses were pervasive. Among the 24 major metropolitan areas with functional urban core populations above 100,000, all experienced reductions in their baby boomer population shares. The average share reduction was approximately 12 percent.
Not surprisingly, the leading urban core magnets of New York and San Francisco did the best, losing 4.3 percent and 5.8 percent of their boomer population share between 2000 and 2010. Providence, Los Angeles,and Boston rounded out the best five.
Among the 24 metropolitan areas with the largest functional urban cores, Detroit experienced the largest proportional boomer loss, at 21.2 percent. Kansas City, Washington, and Minneapolis-St. Paul lost from 17 percent to 19 percent, proportionally, of their boomer urban core populations. Despite its reputation for core renewal, Portland experienced an approximate 15 percent proportional loss of its urban core boomers, along with Milwaukee and Cleveland (Figure 2).
Boomers and the Earlier Suburbs
The reduction in baby boomer population was even greater in the earlier suburban areas (those with median house construction dates of 1979 or before). The 2.33 million earlier suburban population loss was double that of the functional urban core loss, but because of this population is much larger than the functional cores, the overall drop was a smaller 11.1 percent. Nonetheless, the earlier suburbs continue to house the largest share of major metropolitan boomers. This fell, however, from 45.3 percent in 2000 to 42.2 percent in 2010.
Combined, the urban cores and earlier suburbs lost 3.48 million boomers between 2000 and 2010.
Boomers and the Later Suburbs and Exurbs
In contrast, the later suburban areas (median house construction date 1980 or later) added approximately 750,000 baby boomers, for an increase of 6.8 percent. The later suburbs also experienced an increase in their share of major metropolitan boomers, rising from 24.0 percent in 2000 to 26.9 percent in 2010.
The exurban gain was greater than the later suburbs in percentage terms (7.7 percent) but less in population gain (560,000). This was enough to increase the exurban share of boomers from 15.8 percent in 2000 to 17.9 percent in 2010. Indeed, the exurban areas of the 24 major metropolitan areas with urban cores over 100,000 population all did better in attracting or retaining boomer populations than both the urban cores and the earlier suburbs.
Overall there was a 5.0 percentage point transfer of boomer share from the functional urban cores and earlier suburbs to the later suburbs and exurbs, reflecting their more than 1.3 million gain between 2000 and 2010.
Boomers and the Nation
Moreover, the data indicates that boomers are leaving the major metropolitan areas to move to smaller cities or even to rural areas. In contrast with the 2.17 million major metropolitan area loss, areas outside the major metropolitan areas added 350,000 boomers between 2000 and 2010. In 2000, smaller cities and rural areas housed 44.4 percent of the boomer population. By 2010, the smaller city and rural share had risen to 45.8 percent (Figure 3). By contrast, over the same period, the major metropolitan areas increased their proportion of the US population, from 54.5 percent in 2000 to 54.9 percent in 2010.
America's downtowns (generally a smaller area than the larger urban cores), have done much better in recent years, as they have become safer and as a "100 year flood" of economic retrenchment has reduced many to renting rather than buying. Yet, overall, urban cores have done less well, with Census Bureau data showing that the population gains within two miles of largest municipality city halls being more than offset by losses in the two to five mile radius between 2000 and 2010. These loses are not limited to the overall population, but extend to share losses among Millennials and population losses among the boomers.
Wendell Cox is principal of Demographia, an international public policy and demographics firm. He is co-author of the "Demographia International Housing Affordability Survey" and author of "Demographia World Urban Areas" and "War on the Dream: How Anti-Sprawl Policy Threatens the Quality of Life." He was appointed to three terms on the Los Angeles County Transportation Commission, where he served with the leading city and county leadership as the only non-elected member. He was appointed to the Amtrak Reform Council to fill the unexpired term of Governor Christine Todd Whitman and has served as a visiting professor at the Conservatoire National des Arts et Metiers, a national university in Paris.
-----------
City Sector Model Note: The City Sector Model allows a more representative functional analysis of urban core, suburban and exurban areas, by the use of smaller areas, rather than municipal boundaries. The more than 30,000 zip code tabulation areas (ZCTA) of major metropolitan areas and the rest of the nation are categorized by functional characteristics, including urban form, density and travel behavior. There are four functional classifications, the urban core, earlier suburban areas, later suburban areas and exurban areas. The urban cores have higher densities, older housing and substantially greater reliance on transit, similar to the urban cores that preceded the great automobile oriented suburbanization that followed World War II. Exurban areas are beyond the built up urban areas. The suburban areas constitute the balance of the major metropolitan areas. Earlier suburbs include areas with a median house construction date before 1980. Later suburban areas have later median house construction dates.
Urban cores are defined as areas (ZCTAs) that have high population densities (7,500 or more per square mile or 2,900 per square kilometer or more) and high transit, walking and cycling work trip market shares (20 percent or more). Urban cores also include non-exurban sectors with median house construction dates of 1945 or before. All of these areas are defined at the zip code tabulation area (ZCTA) level.


Baby Boomers Leaving Cities
Here is a thought. The cost of living in these cities is beyond most people's retirement income. Downsizing, reducing costs, moving to where taxes are less of a draw on your retirement income is probably the main reason we are leaving. I am planning on it.