
How are states faring in these two years of modest recovery? Change is never simple. States vary in their rates of births and deaths, “natural increase” (or decrease, possibly), rates of immigration from abroad, and especially in domestic, internal migration. I present four maps, for population change, natural increase, immigration, and domestic migration.
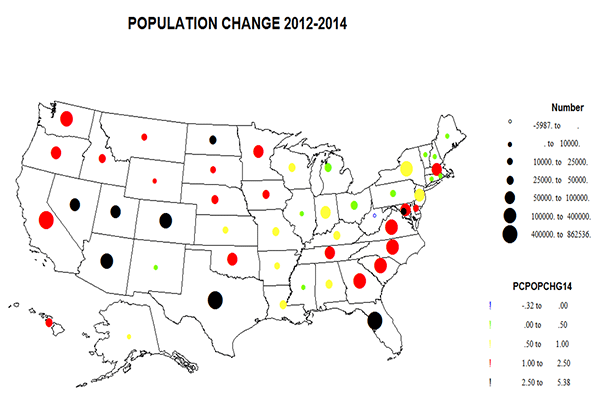
Population change
In sheer numbers Texas beats out California, followed by Florida. Well, these are the 3 most populous states. These are followed by North Carolina, Georgia, Arizona, and Washington. But for the highest rate of growth, the winner is oil boom region North Dakota which easily wins at 5.4%, followed by Washington DC, Texas, Colorado, Utah, and Nevada, all gaining over 3%. Florida is close at 2.8 and Arizona at 2.7. Growth tends to be high in the west, except Alaska and New Mexico, in the South Atlantic states, plus Tennessee, and in the far northern Plains states.
States with the lowest absolute change are paced by the only state to lose population, West Virginia, followed by five New England states, plus New Mexico. States with the lowest rates of growth are broadly similar, West Virginia, New Mexico, and some in New England, but also joined by larger Illinois, Pennsylvania, Michigan, and Ohio. Broadly, the swath of slow growth extends from the Gulf, Lousiana, Mississippi, Alabama, through Arkansas and Missouri, then north and east across the Great Lakes states, Kentucky and West Virginia to much of the northeast, with Massachusetts an outlier of modest growth. What components account for these patterns?
Natural increase
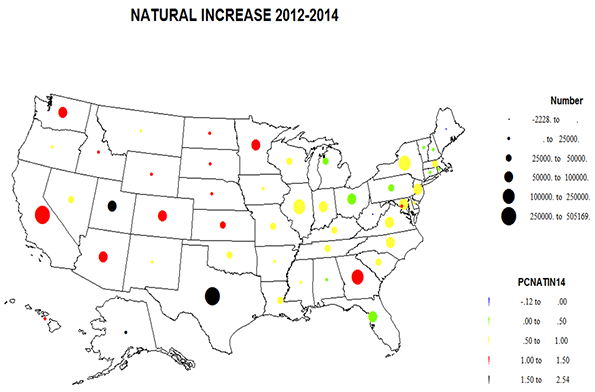
Starting this time with fertility rates, Mormon Utah and wild Alaska win, but non-Mormon Texas is third, then strongly Mormon Idaho, Washington DC, North Dakota (all those young workers), and California. The west stands out with higher rates, along with Georgia and DC. The entire east, from Oklahoma to Florida and Maine, suffer low rates, again except for Georgia and DC. Minnesota joins the northern Plains with higher rates of births than was typical from the immediate past decades.
In numbers, giant California and Texas and New York dominate, followed by Georgia, Illinois, and Virginia. Natural decrease beset West Virginia and Maine, and numbers are low in much of New England and among the smallest states, e.g., Vermont, Delaware, Montana and Wyoming. Note that natural increase is the major component of growth for the most states (25) as expected: AL, AK, AR, CA, DE, GA, ID, IN, IA, KS, KY, LA, MN, Mo, MS, NE, OH, OK, SD, TN, UT, VA, WA, WI, WY.
Immigration
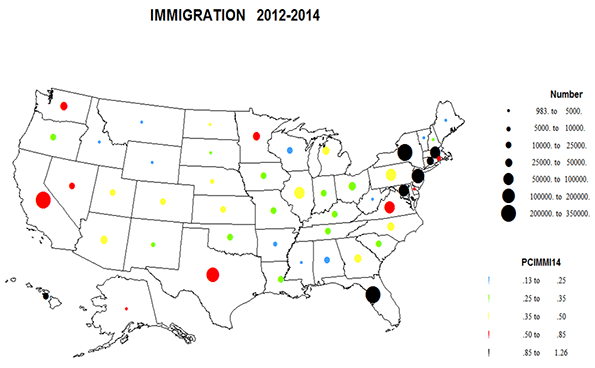
Immigration remains a major component of US population change, but its geography is changing. The highest rate is for Hawaii, but essentially the list is dominated by east coast Megalapolis plus Florida, with amazing rates for New York, New Jersey, Massachusetts, Washington DC, Maryland, and Connecticut. California and Texas, traditional winners, are far down the list as immigration from overseas has boomed while flows from Mexico have been markedly reduced. Washington is moderately high in rate and numbers (migrants, especially Asians, to high tech jobs). In absolute numbers California is still number 1, but New York is second, Florida third, and Texas down to fourth. Overall rates and numbers are low in the inner portions of the east, except for Minnesota and low in most of the interior west. Note that immigration is the main component of growth for HI, ME, MD, MA, NC, RI, NJ- mostly states located in the eastern megalopolis.
Domestic migration
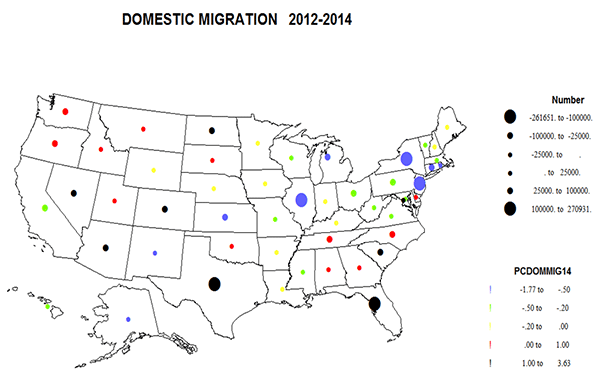
Internal migration is the major force for redistribution of population across states. In numbers, the big gaining states are to Texas and Florida, as has been the case for quite a while, but there are strong gains in Colorado and Arizona as well. In terms of migration gains, increasingly prominent are North and South Carolina and Tennessee, and even Washington. The biggest losing states are again as they have been for some time: New York, Illinois, New Jersey, California (to other states in the west), Pennsylvania, and Michigan.
Highest rates of gain from domestic migration are, not surprisingly, North Dakota, then popular Colorado, South Carolina, Nevada, Florida and Washington, DC, while the higher rates of net out-migration are for Alaska, New York, Illinois, Connecticut, New Mexico and New Jersey. Basically the west wins, except for California, Alaska, and New Mexico, the far southeast gains, while virtually all of the huge quadrant from Kansas to Massachusetts loses. Domestic migration is the main component of growth for CO, DC, FL, MT, NC, ND, NV, OR, SC, and TN (AZ is about equally high in natural increase and in-migration), and is the dominant negative component of change for CT, IL, MI, NM, NY, PA, WV and WI.
Immigration offsets internal out-migration in many states: CA, HI, KY, LA, MA, MD, ME, MN, MO, NE, NH, NJ, NY, PA, RI and VA. The states most balanced in all 3 components of growth – immigration, domestic migration and natural increase – are DE, DC, NC, and WA.
Summary: what does this all tell us?
From studying US population for over 50 years, the essential conclusion is that the story is complex and changeable. Therefore, one shouldn’t make long term forecasts based on two years of experience. It is true that broadly the West and the South Atlantic states have experienced vigorous growth for some time, and that the states from Louisiana and Mississippi to Missouri and then extending east to the Middle Atlantic states grew more slowly, without any obvious signs of a turnaround. But there have been surprises along the edges, perhaps of longer duration, as with ND, SD, and MT developments, while other areas of improved growth, as in MN, MA, and TN, are less sure, as is slower growth in the rest of New England or Alaska. But see below!
Natural increase is normally the least volatile, but even so, note the change from longer term slow-to-greater natural increase for the northern Plains and Minnesota, Georgia stands out in the East.
Immigration is probably the most changeable, as is evident from recent experience, the higher rates of immigrants into Megalapolis, and lower rates in the southwest: TX, NM, AZ. Immigration responds to demand for more technical and professional jobs, as well as for agriculture and construction. But these sectors can be volatile and the effects temporary.
While internal migration has slowed somewhat in the recession, it remains a potent force. Except for the ND, SD, MT phenomenon, the shift from the northeast and lower Mississippi to the west and the southeast, plus redistribution out of California, seems perhaps surprising, rather stable. Nevertheless, the second lesson is that the patterns for the next two years, 2014-2016 could be different! Already in 2015 are news reports of a marked slowdown in North Dakota, due to the plunging price of oil! Sic transit Gloria!
Richard Morrill is Professor Emeritus of Geography and Environmental Studies, University of Washington. His research interests include: political geography (voting behavior, redistricting, local governance), population/demography/settlement/migration, urban geography and planning, urban transportation (i.e., old fashioned generalist).


I think that population of
I think that population of the USA will soon increase more and more because more people will be arriving from abroad. It is known that the visa program is very restrictive, but still can be seen a very large influx of people eg from Europe, who are staying the US permanently.