.JPG")
The Federal Highway Administration reported that driving increased 1.7 percent between 2013 and 2014 in the United States. This compares to virtually no increase over the period from 2004 to 2013. The 2014 increase will come as a disappointment to those who have perceived that the flat driving volumes of recent years signaled a shift in preferences away from driving. It had even been suggested that America had reached "peak car."
Despite the congruity of such sentiments with urban planning orthodoxy, it’s somewhat risky to divine future economic trends from the perspective of a weak economy. It is rather like predicting future employment trends from realities of the late 1930s, when the world had still not climbed out of the Great Depression
The problem for those who seek to replace the car is that the current form of cities, from Phoenix to Paris, requires cars to support the millions with middle-class standard of living. Of course, with a sufficient decline in the standard of living, cars could become less essential. After all, you don’t need a car to not go to work when you are unemployed.
Nor is “peak oil” coming to rescue; we now live in something more like an oil glut. Even when prices were soaring, the amount of driving barely changed. People may have shifted to more efficient cars, they didn't give up their cars, they just drove a little bit less.
The latest driving data may indicate that even the somewhat tepid recovery is speeding up in the United States. This combined with falling gasoline prices is likely to be why driving is increasing again.
Employment Exceeds 2008 Level
Employment is probably the most important factor in the recent recovery of car use
According to data at the St. Louis Federal Reserve Bank "FRED" website, national employment peaked at 138.3 million in January 2008. By early 2010, employment had dropped to under 130 million. It took until April 2014 to restore the employment level that had been previously achieved more than six years earlier. This was the longest employment trough since before World War I, except for the period of 1929 to 1936, during the Great Depression.
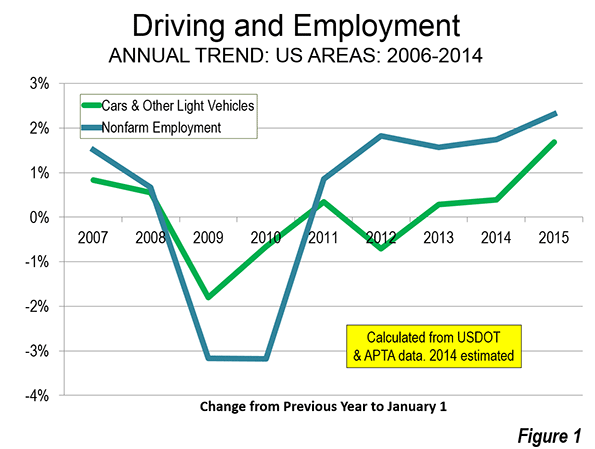
As more people return to employment and incomes rise, driving can be expected to increase. During 2014, the nation's nonfarm employment rose to the highest level in history. As the year progressed and employment increased, so did driving (Figure 1).
But there is still a long way to go for the economy. The civilian labor force participation rate continues depressed. If early 2008 levels of labor participation were restored, there would be at least 10 million additional jobs.
Falling Gasoline Prices
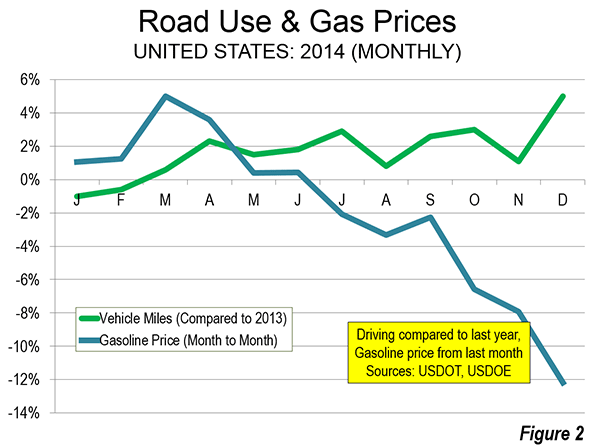
US Department of Energy data indicates that the average price per gallon of gasoline rose by more than one half between 2005 and 2011. Until the middle for 2014, gasoline prices fluctuated around this level until early summer of 2014. Then the gas price reductions began. By the end of 2014, gasoline prices had dropped to near 2005 levels, which they actually reached in early 2015. Much of the 2014 increase in driving was concentrated since the decline in gasoline prices started in the last half of the year (Figure 2).
Driving and Transit
Ridership and road travel data also shows that there has been little relationship between the annual changes in driving and transit use over the period of the gas price increases and the subsequent decrease. Advocates of greater transit funding have claimed for decades that transit can be effective in attracting drivers from their cars. This was transit's time.
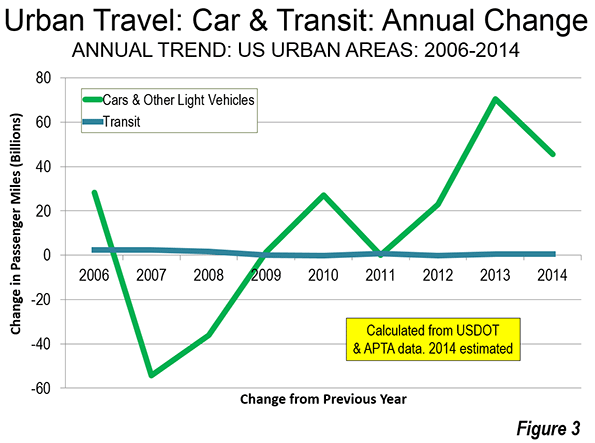
However, the highly publicized transit ridership increases have been small in context and have shown virtually no relationship to the changes in automobile use in urban areas. This is illustrated in Figure 3. Driving volumes have risen and fallen, with little response in transit ridership. If there were a significant relationship between transit ridership and travel by car, the two lines on the chart would nearly follow one another. However, the lines show virtually no relationship. In relation to the actual changes in travel by car and light vehicle, the changes in transit are imperceivable. Transit ridership remains relatively small, at approximately two percent of all trips and five percent of work trips. An American Public Transportation Association (APTA) press release confirms the weak nexus between driving trends and transit for the most recent period. APTA notes that transit ridership late in the year increased despite the significant reduction in gasoline prices.
Transit does not provide rapid mobility for most urban trips, which is why it has so little potential to attract people from cars. As higher prices force people to cut back on driving, they simply travel less, rather than getting on transit that cannot take them where they need to go in a reasonable time. That would be different if transit provided mobility competitive throughout the metropolitan area. Indeed, transit's percentage of urban travel would be far above its current two percent. But to build out a system that reaches most jobs, of course, that would be financially prohibitive.
Transit's strength is downtown (the central business district, or CBD). The largest CBDs have employment densities are 100 times the urban average, and are well served by rapid, radial transit routes. In four of the nation's largest CBDs --- New York, Chicago, Boston and San Francisco --- transit carries more than half of workers to their job, 77 percent in Manhattan alone. Americans use transit where it is competitive or superior to travel by car, which should dispel any notion that there is a national aversion to transit.
But the city is much more than downtown. According to research by Lee and Gordon only eight percent of employment in the 48 largest metropolitan areas was in CBDs. This is despite the presence of impressive office towers that convey a sense of CBD dominance.
Lee and Gordon also show that about 13 percent of jobs are in employment centers centers outside the CBDs, which are often called "edge cities." Because these centers do not have the radial networks of direct transit, even their high densities produce little in transit ridership. My analysis of more than 80 post-World War II form suburban employment centers (mainly edge cities) indicated a transit work trip percentage of only 4.9 percent, which is approximately the national average for all areas. Transit's share to the remaining nearly 80 percent of jobs dispersed throughout the metropolitan areas is just 4.6 percent.
The basic problem is access. Outside of downtowns, few jobs can be conveniently reached by transit. This means transit takes about twice as long as driving alone and often is either not within walking distance of home or does not drop the passenger off within walking distance of work. This is illustrated by research at the University of Minnesota Accessibility Laboratory, which has shown that in 45 large metropolitan areas, only 10 percent of jobs can be reached by the average employee in 60 minutes by transit. By comparison, American Community Survey data indicates that nearly 65 percent of employees who drive alone in the same metropolitan areas actually reach work --- and in half the time (30 minutes).
Even low income workers, whose constrained budgets should make transit more attractive largely use cars to get to work.
Driving and a Middle-Income Lifestyles
I have referred before to the research that equates better economic performance with better mobility for people throughout the labor market (metropolitan area).
Driving is not based on the shallow, arbitrary preference expressed in the threadbare cliché of a "love affair with the automobile." Cars are essential to realizing the aspirations of a majority of people, not only in the United States but in Europe and beyond.
Wendell Cox is an international public policy consultant. He was appointed to three terms on the Los Angeles County Transportation Commission and chaired two American Public Transit Association (APTA) national committees (Policy & Planning and Governing Boards). Full biography is here.


reply
I agree that "Employment is probably the most important factor in the recent recovery of car use". gatwick car parking
Very nice article! It’s
Very nice article! It’s appropriate learning material and seems to be reliable for the approach.
Fast And Furious 7 Coat At NewAmerican
Increase in driving is a
Increase in driving is a very serious issue and should be controlled as soon as possible. Increase rate of driving has no connection to unemployment as per my knowledge because people buy car as per their need. Some buy to fulfill their passion and some to show off. As technology is advancing rapidly more and more efficient cars are manufactured which attracts the users to grab one. But this will lead to more traffic congestion and pollution. As America has reached its “peak car” I don’t think there is any type of solution to stop this as more technology means more cars with vivid features and technology. So, I wonder is there any solution?
Volkswagen Service Huntington beach
The driving level increase
The driving level increase produces more problems of traffic and route diversion. The prices hike is another aspect.