
The deindustrialization of the United States has been widely considered to be a major force in shaping the economy. It’s one thing to measure where decline has been greatest but where has manufacturing survived or even grown? I use Bureau of Labor Statistics data on manufacturing jobs by county for 1967 and 2014. The results were so surprising that I at first could not believe it.
In 1967 the US had 19,423,000 manufacturing jobs, 25% of an employed labor force of 76 million, while in 2014 there were 11,900,000 such jobs, constituting only 8.3 % (that is one-third of the 1967 share). Almost 12 million is still a lot of jobs, and higher productivity probably means that the sheer amount of stuff produced may not have fallen, but the role of manufacturing in employment has certainly shrunk and as we shall see, greatly relocated.
I reproduce a large table, because it is so interesting, indeed so astounding. There are three sections, first counties with over 25,000 manufacturing jobs in 2014 ( there were far more in 1967), then counties with over 50,000 jobs in 1967, but under 25,000 in 2014, and third, a few counties with over 4000 manufacturing jobs in 2014, and where these were a high share (over 40%) of the local labor force. These were the some of the winners from geographic relocation. I also map these changes. The maps include three additional sets of counties: counties with between 10 and 25,000 jobs in 2014, counties with between 25 and 50,000 jobs in 1967, and counties from 33 to 40% in manufacturing in 2014. These groups are summarized in Table 1.
| Table 1: Manufacturing Change 1967-2014 (Measured in 1,000s) | |||||||||
| Set | # of Counties | Character | 2014 jobs | % | 1967 jobs | % | Change | % | % Change |
| 1A |
19
|
> 25k in 2014, gain | 1,102 | 718 | 385 | 54 | |||
| 1B |
50
|
> 25k in 2014 loss | 2,616 | 6,698 | -4,082 | -61 | |||
| 2 |
26
|
> 50k in 1967 | 435 | 2,828 | -2,403 | -85 | |||
| 3 & 6 |
58
|
> 33% manuf in 2014 | 343 | 232 | 111 | 48 | |||
| 4A |
65
|
10 to 25K in 2014, gain | 1,164 | 682 | 482 | 71 | |||
| 4B |
71
|
10 to 25k in 2014, loss | 1,018 | 1,909 | -841 | -44 | |||
| 5 |
26
|
25 to 50k, 1967 | 355 | 1,029 | -674 | -66 | |||
| Mapped |
315
|
7,083 | 60 | 13,555 | 70 | -6,472 | 87 | -48 | |
| Unmapped |
2,835
|
4,822 | 40 | 5,758 | 30 | -976 | 13 | -17 | |
| US |
3,170
|
ALL | 11,900 | 19,323 | -7,423 | -38 | |||
The 315 mapped counties include 60% of the 2014 manufacturing jobs and some 70% of the jobs in 1967. It is evident that the counties with high numbers of manufacturing jobs in 1967 bore the brunt of losses from 1967 to 2014. In contrast, the smaller, mostly unmapped counties lost only modestly as a set. Many larger counties did gain or hold steady, largely outside the traditional manufacturing belt of the north, or from older core counties into new growing suburbs, as we shall see. Since the losses in the larger mapped counties are so much higher a share of the total jobs in 1967 than in 2014, we have a yet stronger indication of de-concentration.
I’ll begin with the biggest losers, who are on table 2. Now New York City may be thriving in 2014, but it has utterly transformed from an industrial dominance to a minor backwater -- the four boroughs dropping their industrial employment from almost 900,000 to a paltry 67,000 jobs, a drop of 92.5%. In New York County (Manhattan) the fall was even more precipitous: 96%. This is not a misprint. Do not turn off your computer! These are joined by an 84% decline for the New Jersey suburbs: 416,000 to 65,000. Philadelphia, greater Boston, St. Louis, and, yes, especially Baltimore, city and county, experienced the same kind of precipitous decline. Can we begin to understand the basis for riot and unrest in these core cities, whose manufacturing departed as soon as integration opened manufacturing jobs to black workers! As a set, these counties lost 2.83 million manufacturing jobs, a drop of 85%.
| Table 2 | |||||
| Set 1: More than 25,000 Manufacturing Jobs in 1967 | |||||
| County | Manuf Jobs 1967 | Manuf Jobs 2014 | Change | % Change | |
| United States | 19,323,000 | 11,900,000 | -7,423,000 | -38.2 | |
| Snohomish County, Washington | 16,000 | 60,156 | 44,156 | 276.0 | |
| Harris County, Texas | 123,000 | 164,479 | 41,479 | 33.7 | |
| San Diego County, California | 64,000 | 97,346 | 33,346 | 52.1 | |
| Maricopa County, Arizona | 59,300 | 91,348 | 32,048 | 54.0 | |
| DuPage County, Illinois | 24,500 | 53,913 | 29,413 | 120.1 | |
| Riverside County, California | 17,000 | 41,519 | 24,519 | 144.2 | |
| Orange County, California | 126,000 | 150,020 | 24,020 | 19.1 | |
| Waukesha County, Wisconsin | 20,000 | 43,232 | 23,232 | 116.2 | |
| Elkhart County, Indiana | 31,300 | 53,705 | 22,405 | 71.6 | |
| Salt Lake County, Utah | 26,000 | 46,402 | 20,402 | 78.5 | |
| San Bernardino County, California | 30,000 | 46,822 | 16,822 | 56.1 | |
| Washington County, Oregon | 12,000 | 27,919 | 15,919 | 132.7 | |
| Ottawa County, Michigan | 16,000 | 31,831 | 15,831 | 98.9 | |
| El Paso County, Texas | 19,000 | 31,000 | 12,000 | 63.2 | |
| Pinellas County, Florida | 18,000 | 28,305 | 10,305 | 57.3 | |
| Fresno County, California | 15,500 | 25,269 | 9,769 | 63.0 | |
| Bexar County, Texas | 26,000 | 30,474 | 4,474 | 17.2 | |
| Suffolk County, New York | 49,000 | 51,967 | 2,967 | 6.1 | |
| Newport News city, Virginia | 25,000 | 26,503 | 1,503 | 6.0 | |
| Sum of gaining counties | 717,600 | 1,102,210 | 384,610 | 54.0 | |
| Tulsa County, Oklahoma | 39,000 | 37,197 | -1,803 | -4.6 | |
| Kent County, Michigan | 60,000 | 57,371 | -2,629 | -4.4 | |
| Tarrant County, Texas | 76,000 | 70,421 | -5,579 | -7.3 | |
| Lake County, Illinois | 41,000 | 35,174 | -5,826 | -14.2 | |
| Kane County, Illinois | 39,000 | 30,327 | -8,673 | -22.2 | |
| Bucks County, Pennsylvania | 40,000 | 27,061 | -12,939 | -32.3 | |
| Greenville County, South Carolina | 41,000 | 26,782 | -14,218 | -34.7 | |
| Hillsborough County, New Hampshire | 40,000 | 25,287 | -14,713 | -36.8 | |
| Sedgwick County, Kansas | 56,000 | 40,629 | -15,371 | -27.4 | |
| Alameda County, California | 80,000 | 63,679 | -16,321 | -20.4 | |
| Multnomah County, Oregon | 49,000 | 32,206 | -16,794 | -34.3 | |
| Santa Clara County, California | 120,000 | 100,981 | -19,019 | -15.8 | |
| York County, Pennsylvania | 51,000 | 31,890 | -19,110 | -37.5 | |
| Lancaster County, Pennsylvania | 54,000 | 33,212 | -20,788 | -38.5 | |
| Guilford County, North Carolina | 54,000 | 32,428 | -21,572 | -39.9 | |
| Winnebago County, Illinois | 49,000 | 25,024 | -23,976 | -48.9 | |
| Berks County, Pennsylvania | 56,000 | 29,439 | -26,561 | -47.4 | |
| Miami-Dade County, Florida | 58,000 | 30,387 | -27,613 | -47.6 | |
| Macomb County, Michigan | 94,000 | 59,114 | -34,886 | -37.1 | |
| Hennepin County, Minnesota | 109,000 | 72,307 | -36,693 | -33.7 | |
| Dallas County, Texas | 138,000 | 94,078 | -43,922 | -31.8 | |
| Oakland County, Michigan | 94,000 | 47,243 | -46,757 | -49.7 | |
| Franklin County, Ohio | 76,000 | 28,991 | -47,009 | -61.9 | |
| Jefferson County, Kentucky | 90,000 | 40,666 | -49,334 | -54.8 | |
| Bristol County, Massachusetts | 78,000 | 26,935 | -51,065 | -65.5 | |
| Middlesex County, New Jersey | 82,000 | 28,277 | -53,723 | -65.5 | |
| Essex County, Massachusetts | 94,000 | 38,451 | -55,549 | -59.1 | |
| Jackson County, Missouri | 85,000 | 25,870 | -59,130 | -69.6 | |
| St. Louis County, Missouri | 97,000 | 35,884 | -61,116 | -63.0 | |
| Summit County, Ohio | 93,000 | 27,965 | -65,035 | -69.9 | |
| King County, Washington | 146,000 | 79,631 | -66,369 | -45.5 | |
| Montgomery County, Pennsylvania | 106,000 | 39,566 | -66,434 | -62.7 | |
| Hamilton County, Tennessee | 95,000 | 25,092 | -69,908 | -73.6 | |
| Bergen County, New Jersey | 107,000 | 33,434 | -73,566 | -68.8 | |
| Marion County, Indiana | 120,000 | 42,808 | -77,192 | -64.3 | |
| New Haven County, Connecticut | 115,000 | 31,792 | -83,208 | -72.4 | |
| Montgomery County, Ohio | 110,000 | 26,188 | -83,812 | -76.2 | |
| Erie County, New York | 134,000 | 42,606 | -91,394 | -68.2 | |
| Hartford County, Connecticut | 151,000 | 57,332 | -93,668 | -62.0 | |
| Monroe County, New York | 133,000 | 38,958 | -94,042 | -70.7 | |
| Fairfield County, Connecticut | 130,000 | 35,507 | -94,493 | -72.7 | |
| Hamilton County, Ohio | 152,000 | 45,901 | -106,099 | -69.8 | |
| Middlesex County, Massachusetts | 166,000 | 59,454 | -106,546 | -64.2 | |
| Worcester County, Massachusetts | 165,000 | 34,677 | -130,323 | -79.0 | |
| Milwaukee County, Wisconsin | 181,000 | 48,963 | -132,037 | -72.9 | |
| Allegheny County, Pennsylvania | 195,000 | 36,428 | -158,572 | -81.3 | |
| Cuyahoga County, Ohio | 277,000 | 69,606 | -207,394 | -74.9 | |
| Wayne County, Michigan | 396,000 | 71,526 | -324,474 | -81.9 | |
| Los Angeles County, California | 855,000 | 359,532 | -495,468 | -57.9 | |
| Cook County, Illinois | 831,000 | 181,315 | -649,685 | -78.2 | |
| Sum of losing counties | 6,698,000 | 2,615,592 | -4,082,408 | -61.0 | |
| Table 2, set 2: Over 50,000 in 1967 and Under 25,000 in 2014 | |||||
| Manuf Jobs 1967 | Manuf Jobs 2014 | Change | % Change | ||
| Bronx | NY | 59,000 | 6,000 | -53,000 | -89.8 |
| Kings | NY | 220,000 | 18,000 | -202,000 | -91.8 |
| Onondaga | NY | 59,000 | 19,000 | -40,000 | -67.8 |
| Queens | NY | 132,000 | 22,000 | -110,000 | -83.3 |
| Westcheste | NY | 73,000 | 12,000 | -61,000 | -83.6 |
| New York, NY | NY | 482,000 | 21,000 | -461,000 | -95.6 |
| Lucas | OH | 62,000 | 16,000 | -46,000 | -74.2 |
| Stark | OH | 63,000 | 23,000 | -40,000 | -63.5 |
| Philadelphia | PA | 264,000 | 23,000 | -241,000 | -91.3 |
| Providence | RI | 93,000 | 22,000 | -71,000 | -76.3 |
| Fulton | GA | 65,000 | 18,000 | -47,000 | -72.3 |
| Nwcastle | DE | 53,000 | 13,000 | -40,000 | -75.5 |
| Lake | IN | 98,000 | 23,000 | -75,000 | -76.5 |
| Baltimore | MD | 68,000 | 11,000 | -57,000 | -83.8 |
| Baltimoecity | MD | 107,000 | 12,000 | -95,000 | -88.8 |
| Hampden | MA | 65,000 | 21,000 | -44,000 | -67.7 |
| Norfolk | MA | 58,000 | 21,000 | -37,000 | -63.8 |
| Suffolkk | MA | 85,000 | 8,000 | -77,000 | -90.6 |
| Ramsey | MN | 72,000 | 23,000 | -49,000 | -68.1 |
| Essex | NJ | 124,000 | 18,000 | -106,000 | -85.5 |
| Hudson | NJ | 107,000 | 8,000 | -99,000 | -92.5 |
| Passaic | NJ | 83,000 | 18,000 | -65,000 | -78.3 |
| Union | NJ | 102,000 | 21,000 | -81,000 | -79.4 |
| StLouis city | MO | 132,000 | 17,000 | -115,000 | -87.1 |
| San Francisco | CA | 52,100 | 7,500 | -44,600 | -85.6 |
| Delaware | PA | 59,600 | 13,000 | -46,600 | -78.2 |
| 2,837,700 | 434,500 | -2,403,200 | -85 | ||
| Table 2, set 3: High Manufacturing Share, Over 4,000 Jobs | |||||
| Manuf Jobs 1967 | Manuf Jobs 2014 | Change | % Change | ||
| Jackson County, Alabama | 3,200 | 5,196 | 1,996 | 62.4 | |
| Boone County, Illinois | 8,300 | 7,619 | -681 | -8.2 | |
| DeKalb County, Indiana | 4,200 | 8,128 | 3,928 | 93.5 | |
| LaGrange County, Indiana | 1,200 | 5,141 | 3,941 | 328.4 | |
| Noble County, Indiana | 4,700 | 8,351 | 3,651 | 77.7 | |
| Whitley County, Indiana | 2,000 | 4,541 | 2,541 | 127.1 | |
| Marion County, Iowa | 1,400 | 6,128 | 4,728 | 337.7 | |
| Ford County, Kansas | 1,000 | 6,272 | 5,272 | 527.2 | |
| Pontotoc County, Mississippi | 1,100 | 6,199 | 5,099 | 463.5 | |
| Scott County, Mississippi | 2,000 | 4,883 | 2,883 | 144.2 | |
| Alexander County, North Carolina | 2,600 | 3,284 | 684 | 26.3 | |
| Bladen County, North Carolina | 1,000 | 5,565 | 4,565 | 456.5 | |
| Auglaize County, Ohio | 5,300 | 7,339 | 2,039 | 38.5 | |
| Shelby County, Ohio | 7,900 | 10,052 | 2,152 | 27.2 | |
| Williams County, Ohio | 5,900 | 6,337 | 437 | 7.4 | |
| Elk County, Pennsylvania | 9,400 | 6,587 | -2,813 | -29.9 | |
| Newberry County, South Carolina | 3,700 | 4,831 | 1,131 | 30.6 | |
| Titus County, Texas | 800 | 5,865 | 5,065 | 633.1 | |
| Box Elder County, Utah | 2,300 | 6,206 | 3,906 | 169.8 | |
| Trempealeau County, Wisconsin | 1,200 | 6,418 | 5,218 | 434.8 | |
| 69,200 | 124,942 | 55,742 | 80.0 | ||
The first set of counties include some winner and more losers. The winners grew from 718,000 to 1,102,000 jobs, or up 54%, but this is dwarfed by the colossal loss of 4.1 million out of 6.7 million jobs, a loss of 61% in manufacturing jobs. The losers are somewhat like set 2, just not quite so extreme. Included are the two counties which lost the most—Cook (Chicago) and Los Angeles- 650,000 and 500,000! Other big losses include Wayne (Detroit), 324,000, Cuyahoga (Cleveland), 207,000, Milwaukee, 132,000, Hamilton (Cincinnati), 106,000, Allegheny (Pittsburgh), 159,000, and Worcester, MA, 136,000.
The gaining larger counties are the beneficiaries of two forms of de-concentration – from the north to the south and west, and from older core counties to their suburbs. Growing industrial centers in the south and west include Harris (Houston), San Diego, Maricopa (Phoenix), Fresno, Bexar (San Antonio), Salt Lake, and Pinellas, FL (St. Petersburg), but as or more important is the growth of suburbs, notably Orange, CA, Suffolk, NY (way out there), San Bernardino-Riverside, Waukesha, WI, Washington, OR, and the biggest winner of all, Snohomish, WA, where Boeing builds big jets, and the home of the late Senator Henry Jackson. This leaves two growing smaller metro areas of the north: Ottawa, MI, and Elkhart, IN, one of the fastest growing and most successful examples of manufacturing and income growth.
Sets 1 and 2 represent the larger manufacturing cores of 1967, 2014 or both. But in 1967 they held 57% of all manufacturing jobs, while in 2014, their share dropped to 35% (10.3 million versus 4.2 million), again illustrating the basic geography of de-concentration.
Sets 3 and set 6 counties, with high manufacturing shares in 2014, include many successful micropolitan or suburban counties in all regions. A few counties with high manufacturing shares in 2014 are suburban, often to smaller metropolitan areas, e.g. Scott, KY, (Lexington). Many more are exurban to medium sized metro areas, as to Springfield, MO, Raleigh, NC, Des Moines, IA or Jackson, MS, and especially 3 counties in northeastern IN, in exurban territory beyond Ft. Wayne and Elkhart.
Some success stories are in more remote small town areas, as AL, AR, TN, MO, OH, SD, NC, SD, TX, and KS, for example, Ford County (Dodge City) and McPherson (Hutchinson Space Center).
Set 4 counties, with 10,000 to 25,000 manufacturing jobs in 2014, again include both losers (71 counties, losing 841,000 jobs, or 44%) and winners, gaining 682,000 jobs, or 71%. Losses are not so severe as for the sets 1, 2, and 5 counties, but are still significant, as in PA, 6 more counties, OH, 3 more, NJ, 3 more, MI, 3 more, and 1 each in MN, CT, IN, KS, CO (Denver), and also several in the south, as in AL (Jefferson-Birmingham), TN, (Shelby-Memphis) and Knox, and NC, 2 counties.
Counties gaining the most include 6 TX counties, Travis (Austin), 2 Houston suburbs, 2 Dallas suburbs, and Potter (Amarillo), 5 CA counties, Kern and Merced in the central valley, and suburban Sonoma, Ventura and Napa, 3 Atlanta suburban counties, 3 UT counties, suburban or exurban to Salt Lake, 2 in CO, Weld (Greeley) and Larimer (Ft. Collins), 2 in LA, and in OH (exurban and small town in the west of the state). Thus almost all are large metro suburbs or smaller independent metro counties. From the list it is clear that these counties well represent the twin trends of suburban-exurban spillover or relocation, as well as the broader de-concentration from the north to the south and west.
Several set 5 counties, 25,000 to 50,000 jobs in 1967, are also in the set 4 list (10,000 to 25,000 job in 2014), often with significant losses. Some with even higher losses, to under 10,000 manufacturing jobs in 2014, include counties in IL, IN, LA (Orleans), MI, NJ, NY (4 more), and PA (4 more).
What do the maps tell us?
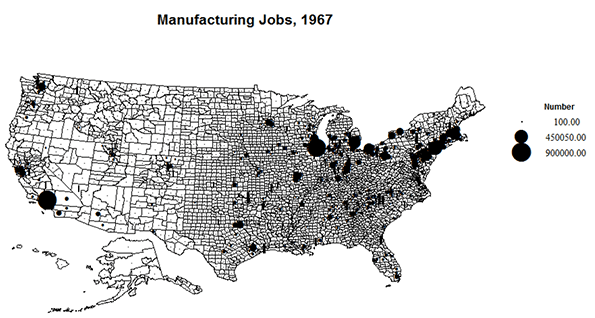
The preceding discussion has probably induced the curious reader to peruse the maps to find places of decline versus growth. The maps show data for only 10 percent of US counties, 315 of 3170. Yet these contained 70% of manufacturing jobs in 1967, and 60% in 2014.
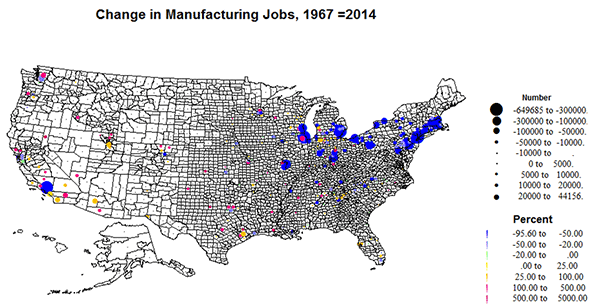
The 1967 and 2014 maps of jobs in manufacturing depict the broad distribution of loss. Although the sheer density and size of places in the traditional industrial belt of the north stand out, a few big losses in the west, notably Los Angeles and San Francisco, appear. But the rests of the south, the plains and the west suggest a widespread if modest expansion, often in proximity to larger declining counties.

The pattern of change from 1967 to 2014 displays the patterns of change in numbers and rates of growth versus decline. Losses are largest and almost continuous from Detroit east to Boston, while in the south, the Midwest and west, the big losers are in older, long standing large centers, Like, LA, SF, New Orleans, St. Louis, Minneapolis, Chicago, Cincinnati, and Indianapolis. These are interspersed with growing centers of manufacturing in TX, across the west, but also quite prominent in suburban and exurban and new industrial places in the south and Midwest, e.g. MS, AL, GA, TN, LA and AR, but in substantial numbers in different areas of OH, IN, MI, WI, IL and MN, KS and MO. While the growth in the burgeoning west and TX might be an expected product of sheer population, and located both in suburbs, as around LA, SF, Portland and Seattle, much was in new independent place such as Boise, Phoenix, Tucson, Salt Lake, Greeley and Ft. Collins, Reno and Las Vegas. In contrast, a pattern of core decline but impressive suburban-exurban growth occurred in parts of the Midwest, in MI, IN, OH, WI, MN, and MO.
Conclusion
Yes, the decline of manufacturing as a dominant part of the labor force is large and rea. But America still makes a lot of stuff, much in quite different places, so that there is no longer a distinctive industrial belt, but in a more dispersed pattern. Many of the older centers of manufacturing, like NY, Boston, Philadelphia, and Chicago and Los Angeles, have long since transformed into world centers of services, while others, like Pittsburgh, Detroit and Cleveland appear to be in a process of transformation.
Some may view this transformation and the huge decline in manufacturing jobs as a benign market effect in which the US specializes in services while much of making things is out-sourced to lower cost countries. But in much of the real America far too few equivalent middle class jobs have replaced the lost jobs. Perhaps what the US needs now is serious innovation in making new kinds of things, and bring manufacturing up to 19 million and beyond! Instead I suspect the ever-wise market will innovate with robots, presaging a time when the country will complete its transformation to an owner and servant society.
Richard Morrill is Professor Emeritus of Geography and Environmental Studies, University of Washington. His research interests include: political geography (voting behavior, redistricting, local governance), population/demography/settlement/migration, urban geography and planning, urban transportation (i.e., old fashioned generalist).


Excellent statistics. Thank
Excellent statistics. Thank you! You may like or at least find interest in my idea for factories in the countryside run on part-time jobs: http://goo.gl/C4k2H7