
Many analysts—usually planners—have been regularly offering a wealth of exhortations concerning how uneconomical it is to purchase, operate and maintain a private car. Is this a valid assertion of a household economic burden? And what is the likelihood that the advice will ultimately prove useful? Household economic decision-making varies greatly, depending principally upon income levels, personal circumstances, and preferences. A single mother with children, or a part-time worker, will make transport choices for radically different reasons than a management executive. With their priorities already set, each of these individuals has little use for generic advice; it is either unhelpful or irrelevant to them.
Such advice often crops up in planning-related journals or web sites. Given that laypeople are unlikely to read these sources, however, the efforts may be largely wasted.
Underlying the production of advice is the presumption that households need it. In theory, consumers can be unaware of costs in certain cases, for example, if a product is relatively new or not universally used, such as e-cigarettes.
This could hardly apply to households and the car market. There are 828 cars per 1000 people in the US; 620 in Canada. Even more telling is market participation by households, as shown by the blue bars in Chart 1, below. By 2012, only about 9% of households did not own a vehicle, compared to over 20% in 1960. These figures speak of a large majority of households in the car market. As for households that opted not to own a car, their absence from the market may be due, at least partly, to their knowledge of the costs.
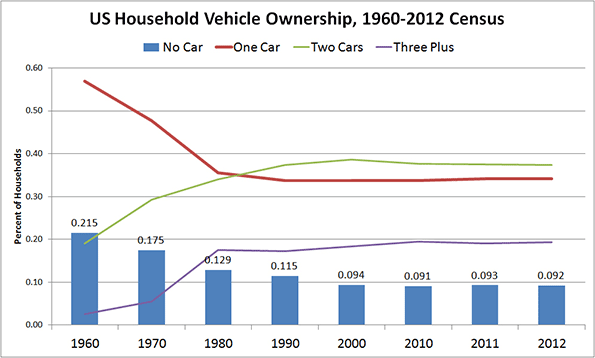 Chart 1 Source: Oak Ridge National Laboratory; Transportation Energy Data Book. Table 8.5.
If knowledge is not at issue, the question becomes whether households manage their expenses on this item prudently, or if they could use expert advice to do so.
Advice on how to manage household transportation expenses is, evidently, also unnecessary. Statistics on household expenditures leave little doubt that households manage their transportation budgets surprisingly well. Consumer surveys show that among all income quintiles, with total household expenditures ranging from about $31,000 to five times that ($155,000), the percentage allocated to transportation is fairly constant – around 15% (Chart 2). The only exception is found among the highest quintile, which may simply be indicative of higher disposable incomes. (We hope readers will be lenient about our use of statistics from multiple countries. The intent is to show trends, rather than report on the specifics of a chosen country.)
Not only is the mid-teen figure constant across different income groups, it is also constant across countries. The European Union, for example, reports 13.0% and 13.2% all across the EU (excluding its newest members). It is hard to interpret this consistency as anything other than an ability to control transportation costs in a way that meets a household’s needs and budget, particularly when seen in juxtaposition to the expenditure on shelter.
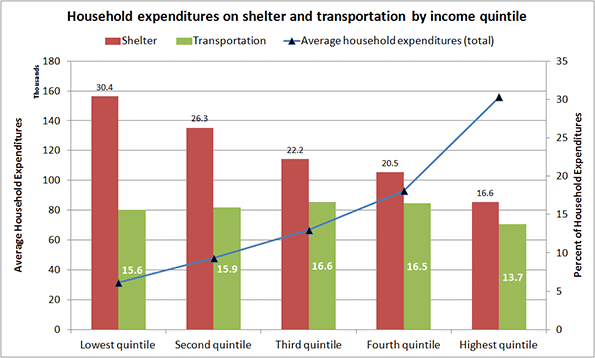 Chart 2 Source: Statistics Canada, Survey of Household Spending. Table 2: Budget Shares Of Major Spending Categories By Income Quintile, 2012.
This consistency of the transportation expense at all income levels is intriguing and instructive.Researchers have suggested that it represents a universal constant. Regardless of its universality, it indicates the adaptability people demonstrate in controlling this expense. This adaptability ranges from choosing the means of transport (foot, bike, transit, car or rail), their level of effort, the time they are willing to spend traveling, and their flexibility in reaching destinations.
For example, public transport lowers costs, but is generally slower than a car (Chart 3). In 2005, 21% of drivers recorded a 90+ minute round trip as opposed to three times that (64%) reported by transit riders. As might be expected, public transport users are predominantly lower quintile households that trade cost for time (Chart 4).
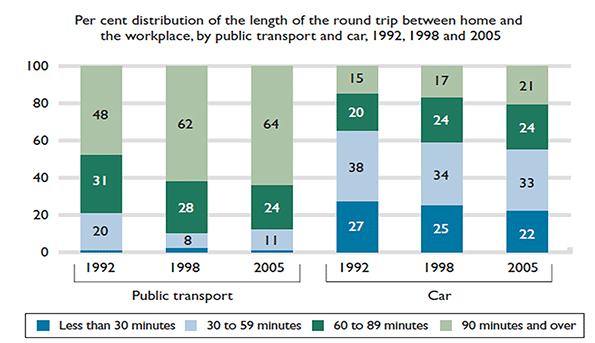 Chart 3 Source: Statistics Canada, General Social Survey, Trip Duration, 1992, 1998, and 2005.
Choosing the mode of transport is one path to controlling costs, and certain households are clearly doing so. As the chart below shows, about 75% of bus riders (adding the first three bars) earn up to $50,000 a year, a lower-rank quintile income. Riding the bus is a conscious choice, as percentages of riders of other income brackets suggest, but for the 75% it may also be an economic necessity.
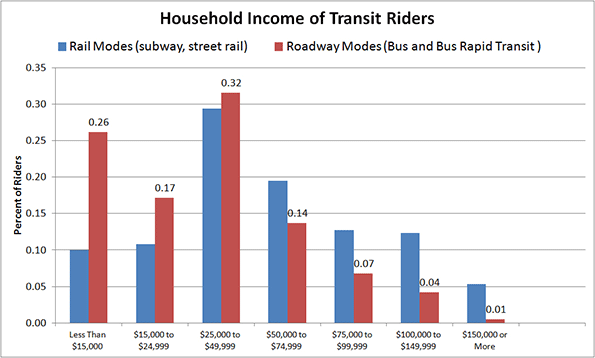 Chart 4 Source: American Public Transportation Association, A Profile of Public Transportation Passenger Demographics and Travel Characteristics, 2007.
Other options in controlling transportation costs include walking and bicycling where possible, accessing the second-hand car market, and choosing other motorized transport.
One good example of 'other' motorized transport is motor scooter ownership in developing nations, and in certain industrialized countries. In Taiwan, for example, “….Scooter is the primary mode of transport on this densely populated island - there are about 15 million for 23 million citizens.” Such wide-spread dependence on scooter-based motorized mobility correlates well with its cost and the per capita GDP of its users. Italy, for example, tops the EU in scooter/motorbike ownership. It may not be pure coincidence that it also has one of the lowest GDPs per capita among EU nations.
The resale market for cars in the US outstrips the new car market by about one to three (Chart 5). Not only is the market large but also, significantly the average cost of a pre-owned car is generally about half its original price.
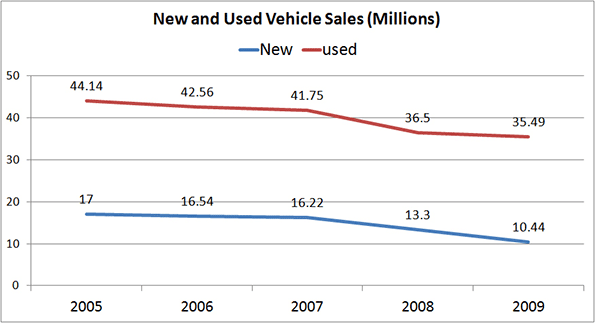 Chart 5 Source: NIADA’s Used Car Sales Industry Report; Relative Size of Car Markets for New and Used Cars, 2010.
The size of the resale market demonstrates yet another means by which consumers—particularly the lower quintile households— seek and grasp the opportunity to control car-related costs. As is evident from Chart 6, three of the five quintiles limit their new car purchases extensively; an overwhelming majority of consumers (averaging 77%) buy used cars. That figure reaches about 81% among the lowest quintile households.
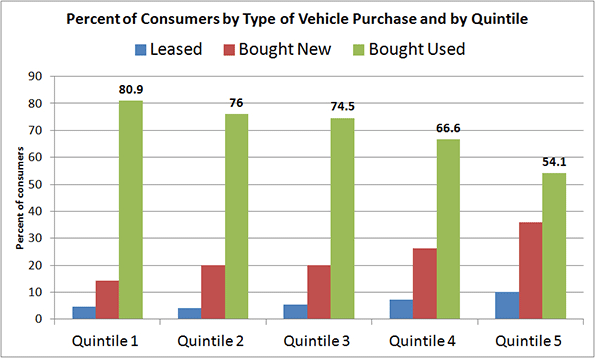 Chart 6 Source: Laura Paszkiewicz, The Cost and Demographics of Vehicle Acquisition, Consumer Expenditure Survey Anthology, 2003 (61) Division of Consumer Expenditure Surveys, US Bureau of Labor Statistics.
Not only does the resale market allow for control of a buyer's initial investment, but segments within the market further enhance that ability. As Chart 7 shows, the price differential between a private sale and that from a franchised dealer can range from double to triple.
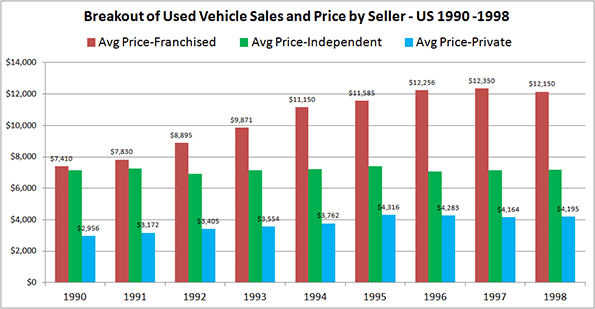 Chart 7 Source: The Used Vehicle Market in Canada, DesRosiers Automotive Consultants Inc., 2000.
The twentieth century saw momentous change and variety in the means of transport, both personal and collective. All new entries except bicycles are motorized, and were unimaginable a mere century earlier. The previous means of transportation — horse-dependent — lasted for at least forty centuries, during which collective transport was non-existent. Motorized personal transport is just one instance in a trend of displacing muscle-dependent activities with motor-driven ones (such as climbing stairs being supplanted by using elevators). The change has been astonishing, unusually fast, and, judging by the plethora of articles on the topic, a cause for concern to some.
Statistics and examples so far allow us to draw at least one indisputable conclusion: Households do know their transportation costs, and adjust their expenditures according to their needs and budget by taking advantage of available opportunities. It would appear that there is little need for guidance on either front.
Fanis Grammenos heads Urban Pattern Associates (UPA), a planning consultancy. UPA researches and promotes sustainable planning practices including the implementation of the Fused Grid, a new urban network model. He is a regular columnist for the Canadian Home Builder magazine, and author of Remaking the City Street Grid: A model for urban and suburban development. Reach him at fanis.grammenos at gmail.com.
After twenty-four years at Canada Mortgage and Housing Corporation, Tom Kerwin now leads an active volunteer life, including being the Science and Environment Coordinator for the Calgary Association of Lifelong Learners. He holds a Master’s degree in Environmental Studies from York University.
Special thanks to Luis Rodriguez for collaborating in shaping this article.
Flickr photo by promich: Car Town, a used car lot in Chicago.


