
A recent New York Times story chronicled the experiences of “extreme commuters,” those who travel two hours or more each way to work. The article focuses on people who commute to New York and notes that there is little or no data on extreme commutes. The Census Bureau, through the American Community Survey (ACS) does not survey two hour commutes. Its maximum classification is 90 minutes or more, though The Times focuses on the 60 minutes and over data, 2013 ACS.
Regrettably, The Times is not terribly clear in its portrayal of the ACS data, in noting that the 21 percent of residents spend more than 60 minutes getting to work, not mentioning whether it is the New York figure or the national figure. It is New York. The most recent 2015 data shows that only 9.0 percent of US workers spend 60 minutes or more getting to work. The New York metropolitan area figure was 21.4 percent.
However, The Times picks up on what’s going on in commuting. People are driving farther to qualify to live the lifestyles they prefer. Urban growth continues to be overwhelmingly in the suburbs, approximately 90 percent since 2010.
Distribution of 90 Minute and Over Commuting
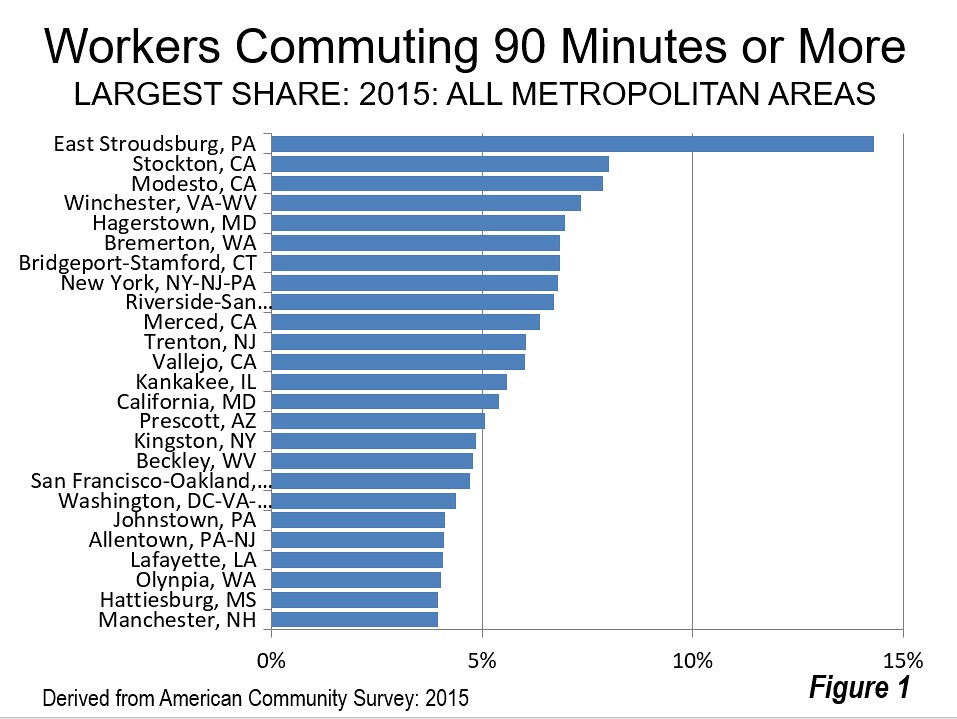
Despite the frequent portrayal of long commuting as the norm, only 2.2 percent of the nation’s workers travel 90 minutes or more, one way to work. Moreover, that long commuting is concentrated in and near just a few combined statistical areas (CSAs), the larger the larger metropolitan area definition that combines adjacent metropolitan areas like Bridgeport-Stamford with New York, San Jose with San Francisco and Riverside-San Bernardino with Los Angeles. Figure 1 shows that 17 of the 25 metropolitan areas with the largest share of 90-plus minute commuters are in or adjacent to just four combined statistical areas (CSAs).
Figure 1 shows that 17 of the 25 metropolitan areas with the largest share of 90-plus minute commuters are in or adjacent to just four combined statistical areas (CSAs), the larger metropolitan area region definition that connects places like New Haven County and Fairfield County with New York, San Jose with San Francisco and Riverside-San Bernardino with Los Angeles.
Seven of the metropolitan areas are in the New York CSA, including New York (NY-NJ-PA), Bridgeport-Stamford (CT), Allentown (PA), Trenton (NJ), Kingston (NY) and East Stroudsburg (PA). The San Francisco CSA has three metropolitan areas among the longest commute metropolitan areas, San Francisco, San Jose and Stockton, as well as adjacent Modesto and Merced. The Washington CSA has four metropolitan areas in the longest 25 commutes, including Washington (DC-VA-MD-WV), California (MD), Hagerstown (MD) and Winchester (VA-WV). Seattle, by far the smallest CSA with more than one metropolitan area in the longest commute CSAs, has two, Bremerton (WA) and Olympia (WA).
East Stroudsburg (New York CSA) has the largest share of 90 and more minute commuters, at 14.3 percent. Stockton (San Francisco CSA) has the second largest number, a much lower 8.0 percent. Nearby Modesto (adjacent to the San Francisco CSA and a candidate for inclusion after 2020) is at 7.8 percent. Winchester and Hagerstown (Washington CSA) are at 7.3 percent and 7.0 percent respectively.
None of this is surprising, considering that each of these markets is plagued by urban containment land use policies that force up house prices. Harvard research indicates that domestic migration is being driven by the differential in house prices and people have been leaving the New York, Washington and San Francisco CSAs for other parts of the country. Seattle has done better, simply because its expensive housing is still a bargain compared to the much more onerous house costs in coastal California, from which migrants are being drawn. The trend in long commutes suggests another dimension to the domestic migration story, as households disperse more in the same general area.
Long Commuting is Expanding
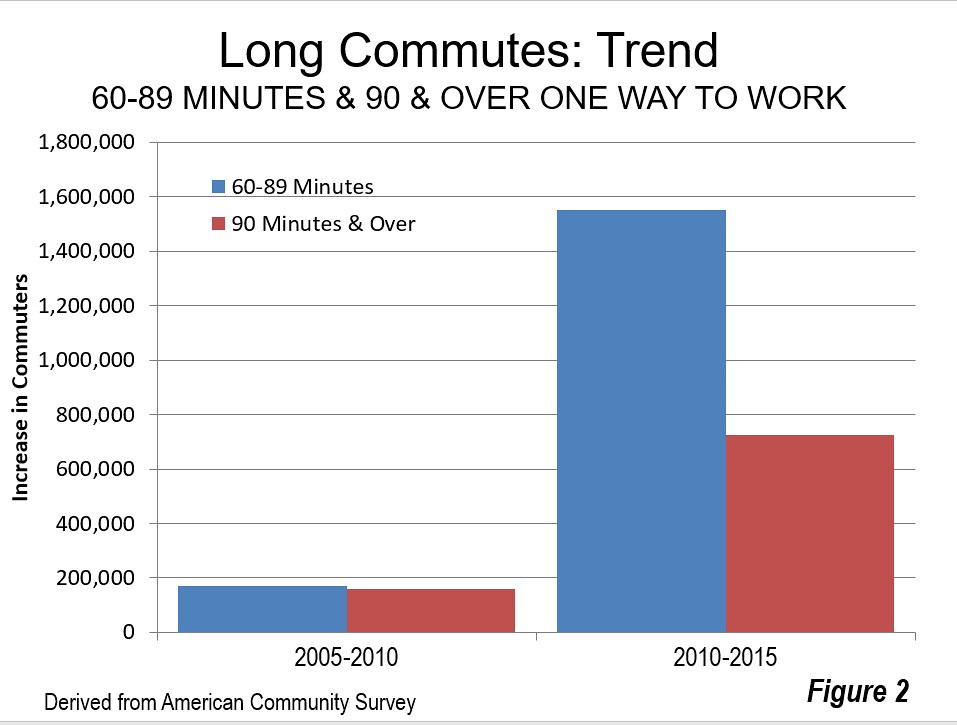
Further, long commuting is expanding. Between 2005 and 2010, the increases were modest, with a market share rise of 3.0 percent among residents traveling 90 minutes or more to work and 0.3 percent among those traveling from 60 to 89 minutes to work. This is not surprising, given the Great Financial Crisis, which began during that period.
However, there was a substantial increase in the trend after 2010. Between 2010 and 2015, the share of residents commuting 90 minutes or more increased 725,000, a market share increase of 13.6 percent. There was an increase of 1,550,000 among residents traveling from 60 minutes to 89 minutes, a market share increase of 12.5 percent (Figure 2). This combined increase of nearly 2.3 million 60 minutes plus commuters is substantial. It is more people that commute to work in the San Francisco metropolitan area (not counting those who work at home) and a larger number than the commuters in all but 10 of the nation’s metropolitan areas.
This continuing dispersion is also indicated in data from the City Sector Model, which shows that suburban and exurban areas continued to attract 80 percent of the new jobs after 2010 (see “America’s Most Suburbanized Cities” and “Suburbs (Continue to) Dominate Jobs and Job Growth”).
Comparisons by Mode of Travel
Data by mode of travel is available only at the 60 minutes and over level, and for just 132 of the metropolitan areas. The percentage of those driving alone for 60 or more minutes is lower than the overall 9.0 percent average, at 7.0 percent. Car and van pool commuters are 60 plus commuters 10.7 percent of the time.
Transit has a far higher level of 60 plus commuting, 38.3 percent at the national level. This is 5.5 times the rate of people driving alone (7.0 percent). While this may be surprising, it is consistent with what is obvious about transit commuting --- that it takes about twice as long as commuting by car. And, transit provides scant job access compared to cars, even in the largest, best served metropolitan areas. On average, major metropolitan area resident can reach more than 40 times as many jobs in 30 minutes by car as by transit (the overall one-way work trip travel time is 26 minutes).
Indeed, among the six metropolitan areas with the “legacy” cores that attract approximately 55 percent of the transit commute destinations in the nation, transit riders much more likely to travel 60 minutes or more to work than those who drive alone. In Philadelphia, the ratio is 3.8, while New York and Chicago transit commuters are 3.6 times as likely to travel 60 minutes or more than those who drive alone. In Boston the figure is 3.1 and San Francisco is 3.0. The smallest difference is in Washington, where transit commuters are only 2.4 times as likely to commute more than one hour than those who drive alone (Figure 3).
In fact, transit commuters were more likely to travel 60 minutes or more to work than those who drive alone in all of the 53 major metropolitan areas (Table). New York has the largest share of residents commuting 60 minutes or more, at 21.4 percent. Washington is second, at 17.3 percent, San Francisco at 17.0 percent, Riverside-San Bernardino, which is adjacent to Los Angeles, at 16.9 percent and Boston at 14.8 percent. Buffalo, Salt Lake City, Oklahoma City, Kansas City and Milwaukee have the smallest share of their residents traveling 60 minutes or more to work, ranging from 2.5 percent to 2.7 percent.
More Dispersion?
The Times article that suggests that the increasing flexibility of companies toward full time working at home could permit people to disperse even more. Despite press reports that working at home is declining, its prospects look good. From 2014 to 2015, working at home experienced the largest increase of any work access mode except driving alone. The increase in work at home was 300,000, while the work at home share rose 5 percent in a single year according to ACS data. Moreover, Global Workplace Analytics reports a 115 percent increase in regular working at home among the non-self employed workforce since 2005, 10 times the increase in the workforce.
These trends indicate that dispersion is continuing in US metropolitan areas as well as between metropolitan areas, as people seek better standards of living.
Additional Data
90 and Over Commute Shares by Metropolitan Area
60 and Over Commute Shares by Mode by Metropolitan Area
| COMMUTE TIMES 60 & OVER MINUTES BY MODE | |||||
| US Major Metropolitan Areas: 2015 | |||||
| Share by Mode | |||||
| All Workers | Rank (Longest to Shortest) | Drive Alone | Transit | Transit X Drive Alone | |
| UNITED STATES | 9.0% | 7.0% | 38.3% | 5.46 | |
| Atlanta, GA | 13.3% | 7 | 12.1% | 40.5% | 3.36 |
| Austin, TX | 7.2% | 24 | 6.5% | 27.9% | 4.32 |
| Baltimore, MD | 12.0% | 9 | 9.5% | 46.2% | 4.85 |
| Birmingham, AL | 6.5% | 31 | 5.7% | 30.0% | 5.31 |
| Boston, MA-NH | 14.8% | 5 | 11.8% | 36.6% | 3.11 |
| Buffalo, NY | 3.4% | 53 | 2.5% | 18.0% | 7.21 |
| Charlotte, NC-SC | 7.1% | 26 | 6.3% | 33.7% | 5.38 |
| Chicago, IL-IN-WI | 14.4% | 6 | 11.0% | 38.7% | 3.50 |
| Cincinnati, OH-KY-IN | 4.8% | 42 | 4.1% | 31.7% | 7.68 |
| Cleveland, OH | 4.9% | 41 | 3.7% | 33.0% | 9.00 |
| Columbus, OH | 4.2% | 46 | 3.7% | 25.1% | 6.80 |
| Dallas-Fort Worth, TX | 8.7% | 16 | 7.7% | 43.6% | 5.65 |
| Denver, CO | 7.8% | 21 | 6.2% | 38.0% | 6.18 |
| Detroit, MI | 6.8% | 30 | 6.1% | 42.5% | 6.95 |
| Grand Rapids, MI | 4.3% | 45 | 3.6% | 25.5% | 7.04 |
| Hartford, CT | 5.0% | 38 | 4.5% | 23.0% | 5.09 |
| Houston, TX | 11.9% | 10 | 11.0% | 39.0% | 3.55 |
| Indianapolis. IN | 5.0% | 39 | 4.6% | 39.4% | 8.64 |
| Jacksonville, FL | 5.6% | 34 | 4.6% | 39.6% | 8.56 |
| Kansas City, MO-KS | 3.6% | 50 | 3.2% | 21.1% | 6.51 |
| Las Vegas, NV | 4.6% | 43 | 2.5% | 45.9% | 18.65 |
| Los Angeles, CA | 12.5% | 8 | 10.8% | 40.6% | 3.77 |
| Louisville, KY-IN | 4.4% | 44 | 3.6% | 31.3% | 8.60 |
| Memphis, TN-MS-AR | 3.8% | 48 | 3.3% | 37.1% | 11.25 |
| Miami, FL | 10.0% | 13 | 8.3% | 43.1% | 5.23 |
| Milwaukee,WI | 3.8% | 49 | 2.7% | 27.2% | 9.89 |
| Minneapolis-St. Paul, MN-WI | 5.5% | 37 | 4.5% | 21.2% | 4.68 |
| Nashville, TN | 8.2% | 18 | 7.7% | 29.6% | 3.84 |
| New Orleans. LA | 7.9% | 20 | 6.7% | 37.9% | 5.64 |
| New York, NY-NJ-PA | 21.4% | 1 | 11.9% | 42.1% | 3.54 |
| Oklahoma City, OK | 3.6% | 51 | 3.1% | 7.5% | 2.40 |
| Orlando, FL | 6.9% | 28 | 5.6% | 42.8% | 7.66 |
| Philadelphia, PA-NJ-DE-MD | 11.4% | 12 | 9.0% | 33.8% | 3.78 |
| Phoenix, AZ | 6.8% | 29 | 5.3% | 41.9% | 7.95 |
| Pittsburgh, PA | 8.0% | 19 | 7.3% | 20.3% | 2.77 |
| Portland, OR-WA | 7.4% | 23 | 5.2% | 28.9% | 5.59 |
| Providence, RI-MA | 9.1% | 15 | 7.3% | 54.7% | 7.47 |
| Raleigh, NC | 6.0% | 32 | 5.0% | 42.8% | 8.61 |
| Richmond, VA | 4.9% | 40 | 4.0% | 33.1% | 8.17 |
| Riverside-San Bernardino, CA | 16.9% | 4 | 15.0% | 48.5% | 3.25 |
| Rochester, NY | 4.0% | 47 | 3.1% | 32.7% | 10.43 |
| Sacramento, CA | 7.6% | 22 | 6.5% | 34.7% | 5.37 |
| St. Louis,, MO-IL | 5.8% | 33 | 4.6% | 36.3% | 7.85 |
| Salt Lake City, UT | 3.5% | 52 | 2.1% | 23.3% | 11.34 |
| San Antonio, TX | 6.9% | 27 | 5.8% | 41.5% | 7.17 |
| San Diego, CA | 7.2% | 25 | 5.6% | 37.5% | 6.73 |
| San Francisco-Oakland, CA | 17.0% | 3 | 12.5% | 37.2% | 2.97 |
| San Jose, CA | 9.4% | 14 | 7.5% | 48.1% | 6.43 |
| Seattle, WA | 11.8% | 11 | 8.9% | 33.6% | 3.78 |
| Tampa-St. Petersburg, FL | 8.4% | 17 | 7.9% | 33.2% | 4.22 |
| Tucson, AZ | 5.5% | 36 | 3.7% | 29.5% | 7.99 |
| Virginia Beach-Norfolk, VA-NC | 5.6% | 35 | 4.8% | 40.1% | 8.35 |
| Washington, DC-VA-MD-WV | 17.3% | 2 | 13.9% | 35.7% | 2.57 |
| Derived from American Community Survey, 2015 | |||||
Wendell Cox is principal of Demographia, an international public policy and demographics firm. He is a Senior Fellow of the Center for Opportunity Urbanism (US), Senior Fellow for Housing Affordability and Municipal Policy for the Frontier Centre for Public Policy (Canada), and a member of the Board of Advisors of the Center for Demographics and Policy at Chapman University (California). He is co-author of the "Demographia International Housing Affordability Survey" and author of "Demographia World Urban Areas" and "War on the Dream: How Anti-Sprawl Policy Threatens the Quality of Life." He was appointed to three terms on the Los Angeles County Transportation Commission, where he served with the leading city and county leadership as the only non-elected member. He served as a visiting professor at the Conservatoire National des Arts et Metiers, a national university in Paris.
Photograph: New Jersey Transit Commuter Train (by author)


