
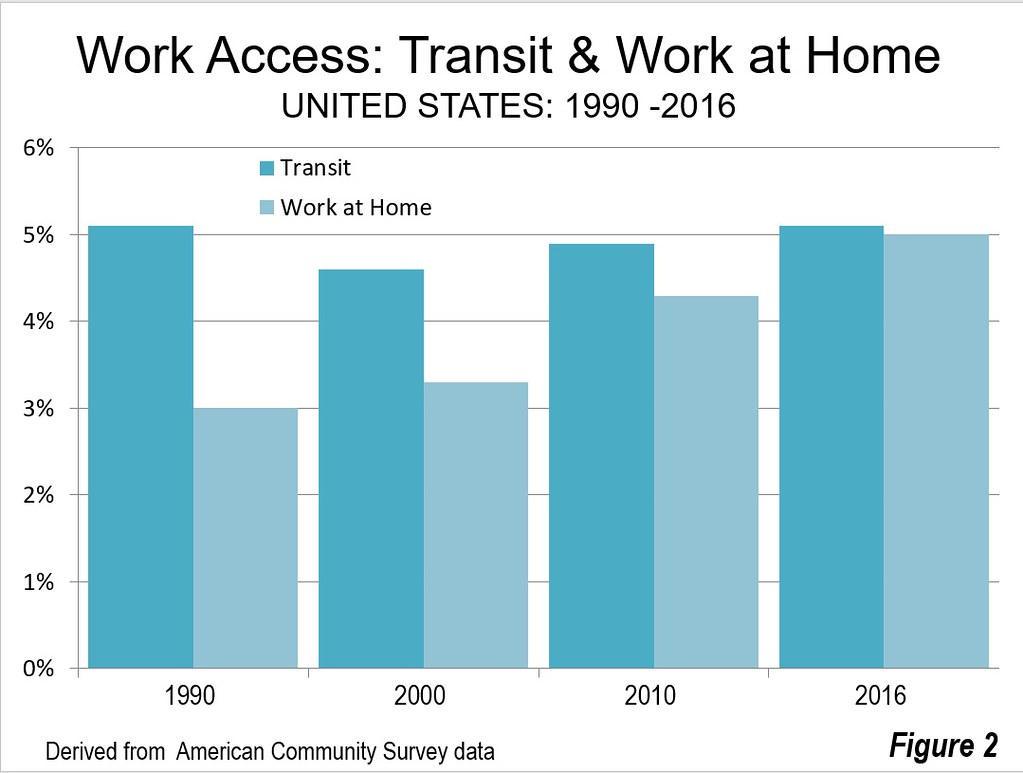
Working at home continues to grow as a preferred access mode to work, according to the recently released American Community Survey data for 2016. The latest data shows that 5.0 percent of the nation's work force worked from home, nearly equaling that of transit's 5.1 percent. In 2000, working at home comprised only 3.3 percent of the workforce, meaning over the past 16 years there has been an impressive 53 percent increase (note). Transit has also done well over that period, having increased approximately 10 percent from 4.6 percent.
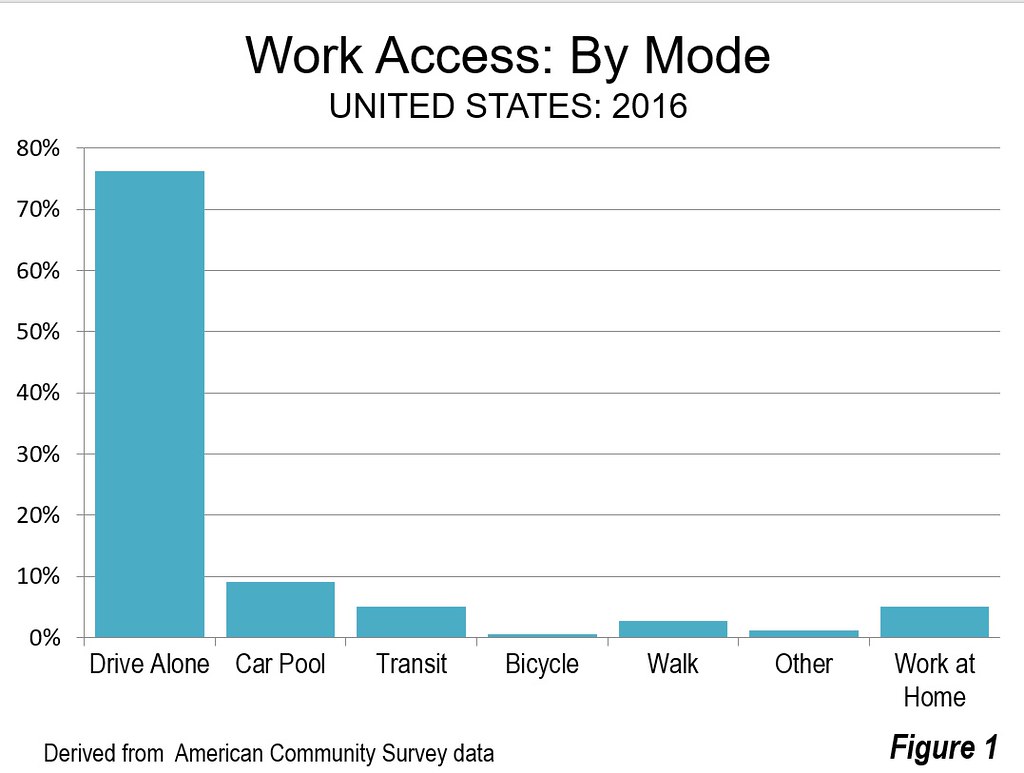
Automobiles continue to be the "work horse" of employment access, with 76.3 percent of the market driving alone and 9.0 percent car pooling or van pooling. By comparison, driving alone was the mode of access for 75.7 percent of workers in 2000 and car pooling or van pooling accounted for 12.2 percent Walking has a 2.7 percent market share, down from 3.3 percent in 2000. On a percentage basis, bicycles, although still a comparatively tiny share, have done about as well as working at home, increasing percent, from 0.4 percent to 0.6 percent between 2000 and 2016, a 43 percent increase (Figure 1).
The market share in the "other" category has stayed constant, at 1.2 percent in both 2000 and 2016. This category includes other modes, including motorcycles, taxicabs and the more recently popular ride hailing services. Despite some thought that Uber and Lyft have begun to attract riders from transit, the work trip data contains no evidence of it. The "other" category market share in 2016 was the same as in 2010 (Figure 1 and Figure 2).
Transit and Work at Home Market Share
Transit has experienced by far its best work trip trend since World War II over the past 16 tears. The 4.6 percent share in 2000 was the nadir, in a fall from 12.1 percent in 1960, the earliest work trip data available. Transit's share has continued to grow modestly since 2010, from 4.9 to 5.1 percent, though widespread overall transit ridership declines have been reported in the last year (here and here).
The work at home share has, in contrast, risen strongly and nearly closed the gap with transit. In 2000, transit had an approximately 1.7 million advantage on working at home. By 2016, the difference had fallen below 60,000. Now, 43 of the 53 major metropolitan areas (over 1,000,000 population) --- including the second largest metropolitan area Los Angeles -- have more people working at home than riding transit to work.
Comparing Working at Home with Transit in New Rail Metropolitan Areas
Even huge expenditures of taxes have failed to keep transit more popular with workers than working at home in many metropolitan areas. This includes metropolitan areas that have built new rail systems:
• Austin, Charlotte, Dallas-Fort Worth, Nashville and Phoenix where nearly four or more times as many work at home as commute by transit.
• Orlando and Sacramento where about three times as many people work at home as use transit.
• Atlanta, Denver, Houston and Riverside-San Bernardino, St. Louis, San Diego and Virginia Beach-Norfolk, where about twice as many people work at home as ride transit to work.
• The work at home advantage over transit is smaller in Miami, Minneapolis-St. Paul, Portland, Salt Lake City and San Jose.
• The same is true of Los Angeles. Despite spending more than $15 billion (2016$) building and opening an extensive urban rail and busway system, not only has working at home recently passed transit, but ridership on the largest transit system has fallen from before opening the first line.
On the other hand, rail ridership is more than double the work at home share in other metropolitan areas that have opened new rail systems since the 1970s. In San Francisco and Washington, the transit share is more than double the work at home share. In Seattle it is more than 50 percent higher, and it is also higher in Baltimore.
Where Working at Home is the Most
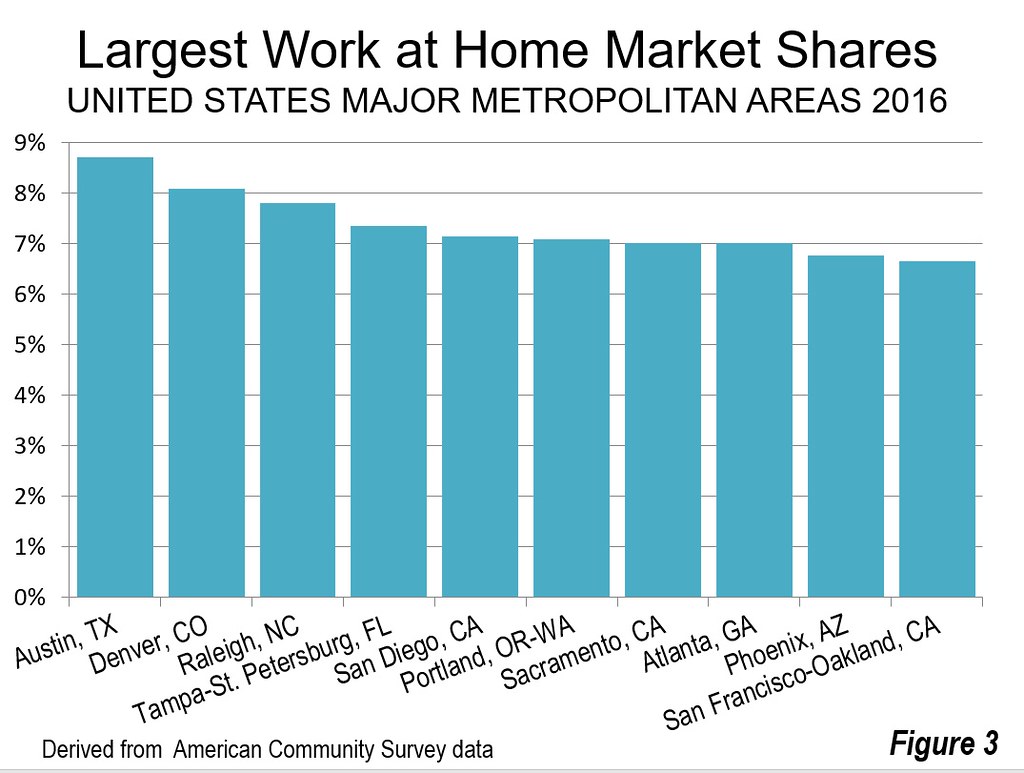
As might be expected, high-tech hubs lead in working at home. Austin has the largest work at home share, at 8.7 percent. Austin is followed by other tech-heavy metropolitan areas Denver (8.1 percent) and Raleigh (7.8 percent). Tampa-St. Petersburg, San Diego, Portland, Sacramento and Atlanta have shares of 7.0 percent or more. Charlotte and San Francisco-Oakland round out the top 10 (Figure 2).
The distribution of transit and work at home shares is much different. Among the 53 major metropolitan areas, the largest transit market share is in New York, at 31.2 percent, while the smallest is in Oklahoma City, at 0.4 percent, a spread of more than 80 times (8,000 percent). The median metropolitan area has a transit work trip market share of 2.6 percent.
Leader Austin's work at home market share is less than the transit shares in the six metropolitan areas with transit legacy cities (the core municipalities [not the metropolitan areas] of New York, Chicago, Philadelphia, San Francisco, Boston, Washington) as well as Seattle, in all of which more than nine percent of workers use transit. Nearly 60 percent of the transit work trips are to destinations in the core municipalities of these metropolitan areas, most of that in the downtown areas (central business districts). Thus, 60 percent of commuting is to areas having less than 7 percent of the nation's employment and less than one percent of nation's urban land area.
Working at home is much more evenly spread around the nation. The market share range is from 8.7 percent in Austin to 2.9 percent in Buffalo. The middle value is 5.2 percent, double that of transit. Thirty of the 53 major metropolitan areas have smaller transit work trip market shares than last ranking Buffalo's work at home market share (Table).
| Work Access Mode: Major Metropolitan Areas: 2016 | |||||||
| Drive Alone | Car Pool | Transit | Bicycle | Walk | Other | Work at Home | |
| Atlanta, GA | 77.6% | 9.2% | 3.1% | 0.3% | 1.3% | 1.5% | 7.0% |
| Austin, TX | 76.0% | 9.4% | 2.2% | 0.8% | 1.7% | 1.1% | 8.7% |
| Baltimore, MD | 76.6% | 8.3% | 6.1% | 0.3% | 2.6% | 1.1% | 4.9% |
| Birmingham, AL | 85.6% | 8.9% | 0.5% | 0.1% | 1.1% | 0.9% | 2.9% |
| Boston, MA-NH | 66.6% | 7.5% | 13.1% | 1.0% | 5.2% | 1.4% | 5.2% |
| Buffalo, NY | 82.8% | 7.4% | 3.5% | 0.4% | 2.4% | 0.6% | 2.9% |
| Charlotte, NC-SC | 80.9% | 9.2% | 1.4% | 0.0% | 1.3% | 1.0% | 6.3% |
| Chicago, IL-IN-WI | 70.3% | 7.6% | 12.0% | 0.7% | 3.1% | 1.2% | 5.1% |
| Cincinnati, OH-KY-IN | 81.7% | 7.8% | 1.9% | 0.2% | 2.1% | 0.7% | 5.5% |
| Cleveland, OH | 81.3% | 7.6% | 3.1% | 0.3% | 2.3% | 0.9% | 4.5% |
| Columbus, OH | 82.5% | 7.5% | 1.6% | 0.3% | 2.2% | 1.2% | 4.7% |
| Dallas-Fort Worth, TX | 80.8% | 9.7% | 1.4% | 0.1% | 1.2% | 1.1% | 5.7% |
| Denver, CO | 75.2% | 8.5% | 4.0% | 0.7% | 2.3% | 1.2% | 8.1% |
| Detroit, MI | 84.3% | 8.2% | 1.5% | 0.3% | 1.3% | 0.8% | 3.6% |
| Grand Rapids, MI | 81.5% | 8.5% | 1.8% | 0.7% | 2.4% | 0.6% | 4.4% |
| Hartford, CT | 80.4% | 8.1% | 3.1% | 0.2% | 2.5% | 1.0% | 4.8% |
| Houston, TX | 80.8% | 10.2% | 1.9% | 0.2% | 1.4% | 1.3% | 4.1% |
| Indianapolis. IN | 84.5% | 7.4% | 0.7% | 0.3% | 1.6% | 0.8% | 4.6% |
| Jacksonville, FL | 81.0% | 7.7% | 1.7% | 0.6% | 2.0% | 1.4% | 5.7% |
| Kansas City, MO-KS | 83.8% | 7.9% | 0.9% | 0.2% | 1.3% | 0.8% | 5.2% |
| Las Vegas, NV | 79.4% | 9.9% | 3.7% | 0.3% | 1.2% | 1.5% | 4.0% |
| Los Angeles, CA | 75.0% | 9.6% | 5.1% | 0.8% | 2.5% | 1.4% | 5.5% |
| Louisville, KY-IN | 82.5% | 8.4% | 1.8% | 0.2% | 1.5% | 1.2% | 4.4% |
| Memphis, TN-MS-AR | 83.2% | 9.8% | 1.1% | 0.1% | 1.1% | 1.0% | 3.6% |
| Miami, FL | 77.7% | 9.3% | 3.8% | 0.5% | 1.7% | 1.4% | 5.5% |
| Milwaukee,WI | 80.4% | 8.2% | 3.6% | 0.5% | 2.7% | 0.7% | 3.9% |
| Minneapolis-St. Paul, MN-WI | 77.7% | 8.1% | 4.7% | 0.8% | 2.1% | 0.8% | 5.7% |
| Nashville, TN | 81.8% | 8.7% | 0.9% | 0.1% | 1.3% | 1.1% | 6.1% |
| New Orleans. LA | 77.2% | 11.0% | 2.6% | 1.1% | 2.2% | 1.4% | 4.4% |
| New York, NY-NJ-PA | 49.5% | 6.6% | 31.4% | 0.7% | 5.8% | 1.4% | 4.5% |
| Oklahoma City, OK | 83.2% | 9.2% | 0.4% | 0.4% | 1.5% | 1.1% | 4.1% |
| Orlando, FL | 80.5% | 9.1% | 1.9% | 0.4% | 1.1% | 1.3% | 5.8% |
| Philadelphia, PA-NJ-DE-MD | 72.6% | 7.9% | 9.3% | 0.6% | 3.6% | 1.0% | 5.1% |
| Phoenix, AZ | 76.2% | 11.2% | 1.8% | 0.7% | 1.5% | 1.7% | 6.8% |
| Pittsburgh, PA | 76.7% | 8.2% | 6.0% | 0.4% | 3.2% | 0.8% | 4.8% |
| Portland, OR-WA | 70.9% | 9.1% | 6.4% | 2.3% | 3.2% | 1.0% | 7.1% |
| Providence, RI-MA | 80.9% | 8.3% | 2.5% | 0.2% | 3.4% | 0.7% | 3.9% |
| Raleigh, NC | 80.6% | 8.1% | 1.2% | 0.3% | 1.0% | 0.9% | 7.8% |
| Richmond, VA | 82.4% | 8.1% | 1.4% | 0.5% | 1.9% | 1.0% | 4.7% |
| Riverside-San Bernardino, CA | 78.4% | 11.8% | 1.3% | 0.3% | 1.5% | 1.2% | 5.5% |
| Rochester, NY | 80.8% | 7.8% | 2.6% | 0.4% | 3.5% | 0.7% | 4.2% |
| Sacramento, CA | 76.9% | 9.5% | 2.1% | 1.6% | 1.8% | 1.1% | 7.0% |
| St. Louis,, MO-IL | 82.6% | 7.1% | 2.6% | 0.3% | 1.6% | 0.8% | 5.0% |
| Salt Lake City, UT | 74.8% | 10.7% | 4.6% | 0.7% | 2.5% | 1.0% | 5.8% |
| San Antonio, TX | 79.0% | 10.6% | 2.3% | 0.2% | 1.9% | 1.3% | 4.8% |
| San Diego, CA | 75.7% | 8.9% | 2.9% | 0.7% | 3.2% | 1.5% | 7.1% |
| San Francisco-Oakland, CA | 58.1% | 9.6% | 17.2% | 2.1% | 4.5% | 2.0% | 6.7% |
| San Jose, CA | 74.5% | 10.6% | 4.3% | 1.6% | 2.3% | 1.3% | 5.3% |
| Seattle, WA | 68.3% | 9.7% | 9.5% | 1.1% | 4.1% | 1.1% | 6.1% |
| Tampa-St. Petersburg, FL | 78.9% | 8.5% | 1.4% | 0.8% | 1.5% | 1.6% | 7.4% |
| Tucson, AZ | 76.4% | 10.5% | 2.6% | 1.6% | 1.9% | 1.5% | 5.4% |
| Virginia Beach-Norfolk, VA-NC | 79.7% | 9.3% | 1.8% | 0.4% | 3.8% | 1.6% | 3.5% |
| Washington, DC-VA-MD-WV | 65.9% | 9.3% | 13.4% | 0.9% | 3.4% | 1.4% | 5.7% |
| Major MSAs | 73.4% | 8.7% | 7.9% | 0.6% | 2.7% | 1.2% | 5.4% |
| United States | 76.3% | 9.0% | 5.1% | 0.6% | 2.7% | 1.2% | 5.0% |
| Outside Major MSAs | 80.4% | 9.4% | 1.2% | 0.5% | 2.7% | 1.2% | 4.6% |
| Source: American Community Survey, 2016 | |||||||
The Future
There is considerable potential for expanding the work at home share of work access, as is indicated by Global Workplace Analytics and Flexjobs in their report (The State of Telecommuting in the U.S. Employee Workforce). The advantages are great. Working at home is by far the most environmentally friendly mode of work access and requires virtually no public subsidies.
Note: Calculated using two-digit data.
Wendell Cox is principal of Demographia, an international public policy and demographics firm. He is a Senior Fellow of the Center for Opportunity Urbanism (US), Senior Fellow for Housing Affordability and Municipal Policy for the Frontier Centre for Public Policy (Canada), and a member of the Board of Advisors of the Center for Demographics and Policy at Chapman University (California). He is co-author of the "Demographia International Housing Affordability Survey" and author of "Demographia World Urban Areas" and "War on the Dream: How Anti-Sprawl Policy Threatens the Quality of Life." He was appointed to three terms on the Los Angeles County Transportation Commission, where he served with the leading city and county leadership as the only non-elected member. He served as a visiting professor at the Conservatoire National des Arts et Metiers, a national university in Paris.
Photograph: Texas State Capital, Austin (largest work at come work access mode).
https://commons.wikimedia.org/wiki/File:Texas_State_Capitol_Night.jpg


