
There are few issues, if any, more important than income and poverty. The most successful political jurisdictions, where national or sub national, are characterized by rising incomes and falling rates of poverty. A large and growing middle-class is key to that. But measuring the size and trend of the middle-class is easier said than done. There is considerable concern about the threat to the middle-class, which is most evident in the high cost California markets (See: California Feudalism: The Squeeze on the Middle-Class).
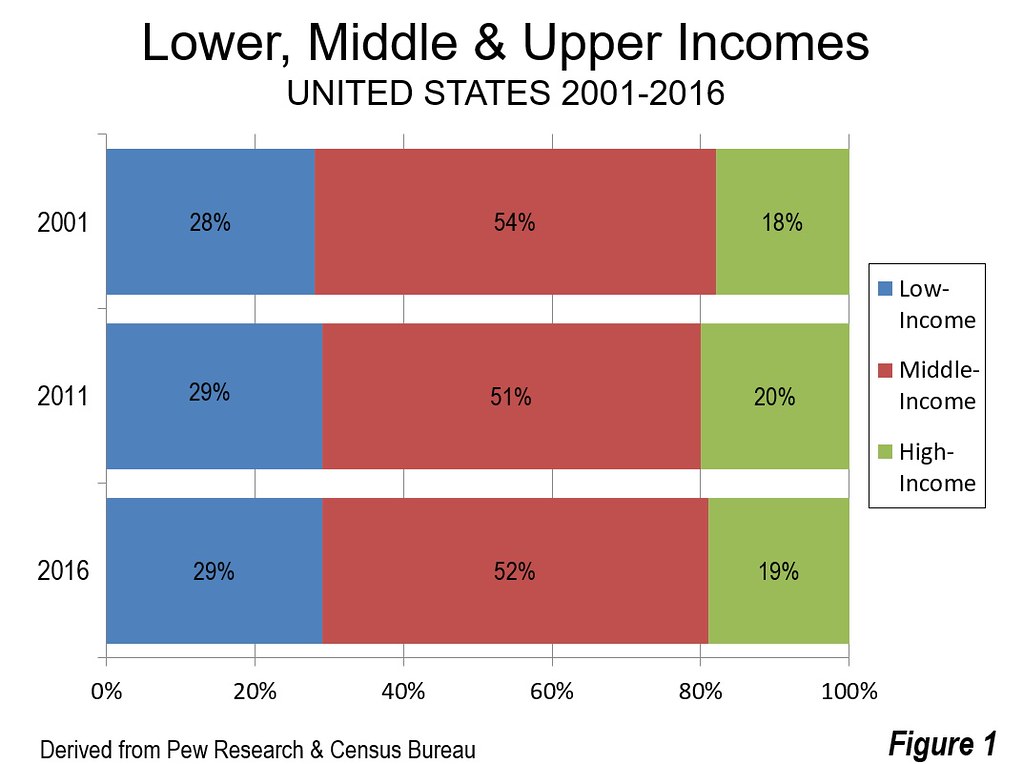
For years, Pew Research has been a leader in providing estimates of the size and trends relating to the middle class. More recently, Pew has incorporated cost of living adjustments into its analysis. Consistent with the familiar narrative, the middle-class is shrinking, having dropped from 54 percent of the population in 2001 to 52 percent in 2016. But this is not all bad. One-half of the households have moved up to higher income status, while one-half have moved down, to low income status (Figure 1). Overall, 71% of households had middle and higher incomes in 2016, according to Pew.
This article analyses the latest Pew Research data for 2016, focusing on the 53 major metropolitan areas (those with over one million population).
Major Metropolitan areas
Pew provides data for 260 metropolitan areas, adjusting for both households size and the cost of living, as estimated in the Bureau of Economic Analysis Regional Price Parities (BEA RPPs). The data is available here.
Pew’s definition of the middle-class is as follows:
“Middle-income” Americans are adults whose annual household income is two-thirds to double the national median, after incomes have been adjusted for household size. In 2016, the national middle-income range was about $45,200 to $135,600 annually for a household of three (incomes in 2016 dollars). The same standard is used to determine the status of households in all metropolitan areas after their incomes have been adjusted for the cost of living in the area.
The Pew standard considers household incomes in each metropolitan area based upon the national median and income distribution.
Major Metropolitan Areas with the Largest Middle-Income Share
Among the nation’s 53 major metropolitan areas (over 1,000,000 population), the Twin Cities metropolitan area of Minneapolis-St. Paul has the largest share of households with middle and higher incomes (80.9%), and as a result, the lowest share of lower-income households (Figure 2). Washington, DC-VA-MD-WV ranks second, at 80.4%. Hartford and Boston both score above 79%. Hartford has been cited as the most affluent metropolitan area in the world in 2012 and third most affluent in 2015. Boston ranked fifth most affluent in the world in 2015.
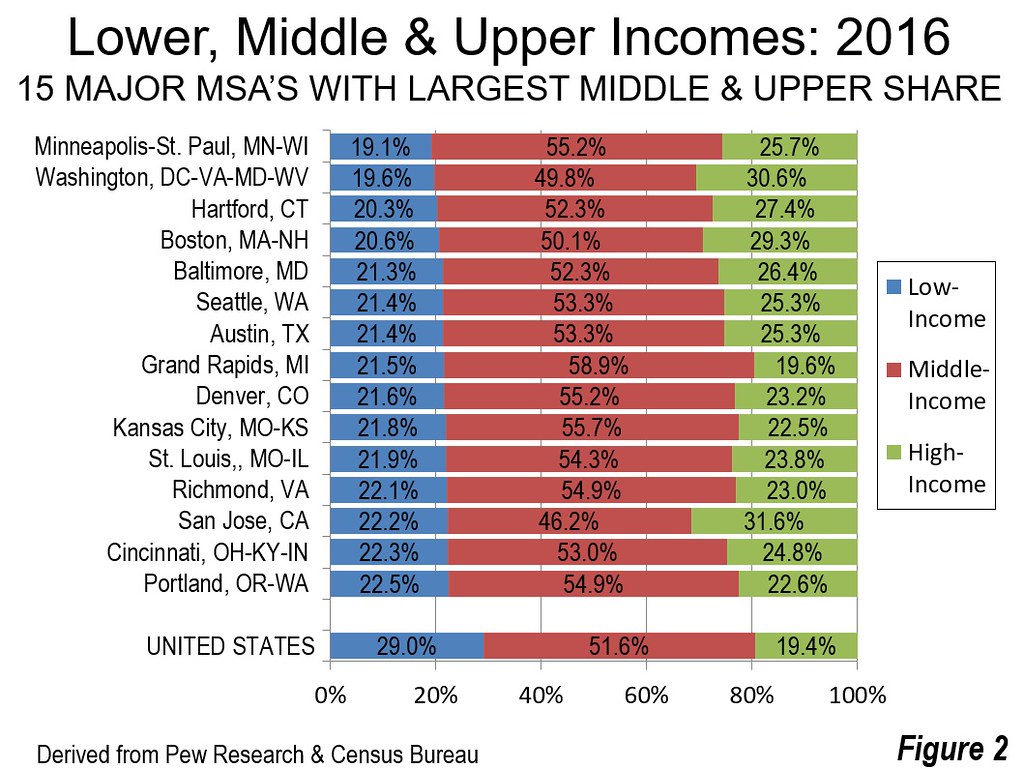
The balance of the top ten is rounded out by seven metropolitan areas with at least 78% of their households at or above middle-income level, Baltimore, Seattle, Austin, Grand Rapids, Denver and Kansas City. Baltimore is well within the economic orbit of Washington, being inside the federal city’s combined statistical area. Austin is a predictable entry, given its strong information technology industry and its cost of living that at 100.0, matches the national average, according to the BEA RPPs. Grand Rapids may be surprising, but it is among a growing number of Midwestern metropolitan areas where low costs of living portend a bright future for middle-income growth. These include 10th ranking Kansas City, 11th ranking St. Louis and 13th ranking Cincinnati with improving economic performance.
Richmond ranks 12th, San Jose is in a 13th place tie with Cincinnati and Portland (Oregon) ranks 15th. San Jose is particularly noteworthy, as its highest median household income is substantially discounted by its highest cost of living, the result of its astronomical house prices. Even so, San Jose has the largest upper income segment in the nation, so large that it reduces San Jose’s middle class to the smallest among the major metropolitan areas. Similarly high income San Francisco, located in the same combined statistical area as San Jose, ranks a lower 18th in the share of its middle and higher income households.
Major Metropolitan Areas with the Smallest Middle-Income Share
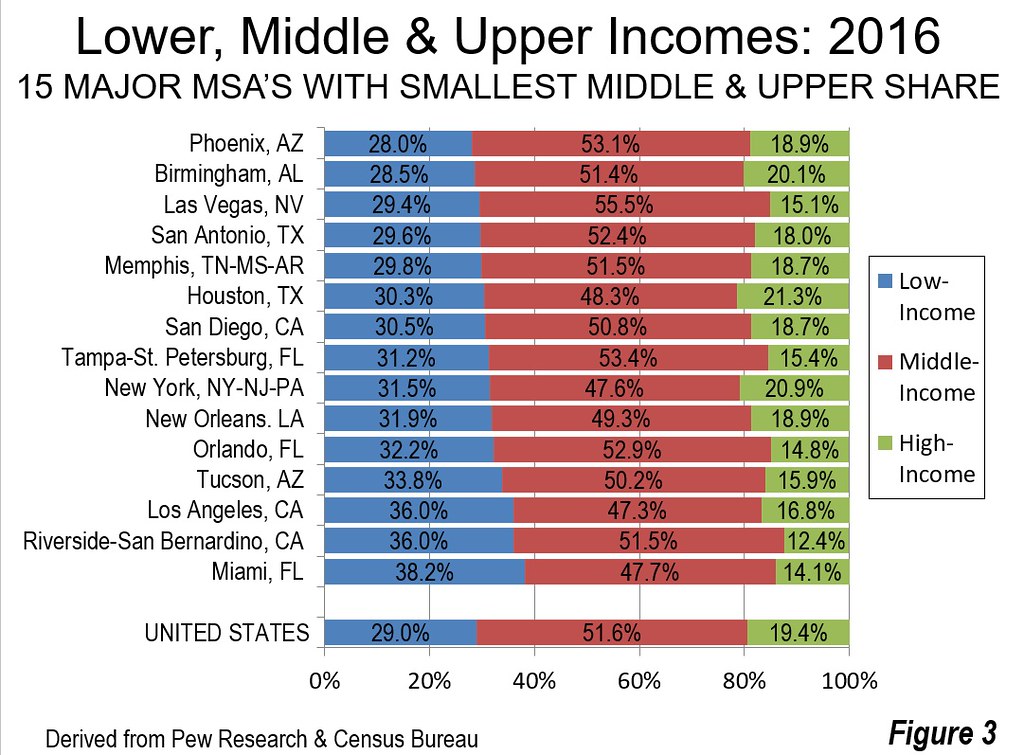
Miami, ranked 53rd, has the lowest share of households with middle or higher incomes, at 61.8%, nearly a quarter below leader Minneapolis-St. Paul’s 80.9%. Riverside-San Bernardino and Los Angeles, in the same combined statistical area, rank 52nd and 51st respectively in the share of households that have middle or higher income. Each of these three metropolitan areas has a high cost of living, driven by their much higher than average housing costs.
Tucson and Orlando have the fourth and fifth smallest number of households with middle and higher incomes. The second five includes New Orleans, New York, Tampa-St. Petersburg, San Diego and Houston. Among the 10 with the lowest middle and higher income share, all but four have foreign born population shares exceeding 20%, including Miami, Riverside-San Bernardino, Los Angeles, New York, San Diego and Houston.
Middle and Higher Income Household Shares by Size of Metropolitan Area
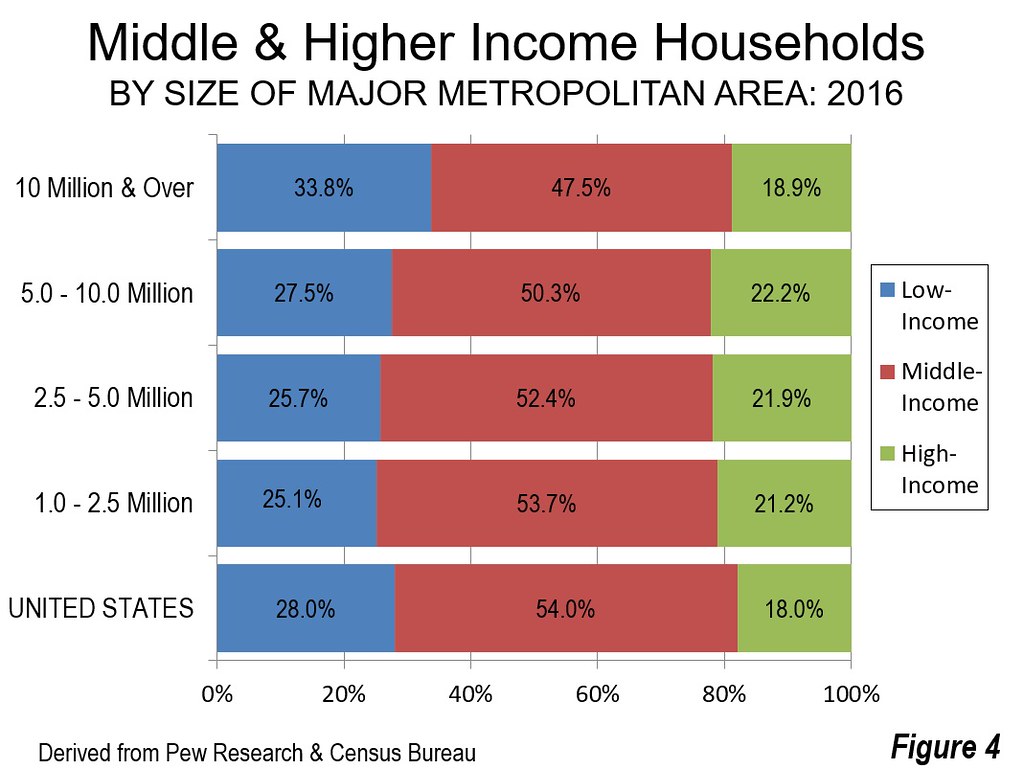
Among the major metropolitan areas, the largest middle and higher income shares of the population are those with the smallest population. In metropolitan areas with from 1.0 to 2.5 million population, 75% of the households have middle or higher incomes, while 25% have lower incomes. The next higher category, from 2.5 to 5.0 million population, have 74% of their households with middle or higher incomes and 26% with lower incomes. Among the metropolitan areas with from 5.0 to 10,0 million, the more affluent share falls to under 73% and the lower income share exceeds 27%.
Things are much different in the megacities (over 10 million), In these two metropolitan areas, New York and Los Angeles, the lower income share rises to nearly 34%, leaving little more than 66% for the middle and lower income share. This is more than an 11% smaller middle and upper income share than in the smallest major metropolitan areas, and 9% smaller than in the middle two population categories (Figure 4). The two metropolitan areas that constitute this most populous category, New York and Los Angeles have very high costs of living, which discounts their nominally higher incomes significantly in purchasing power.
Middle and Higher Income Household Shares and Housing Affordability
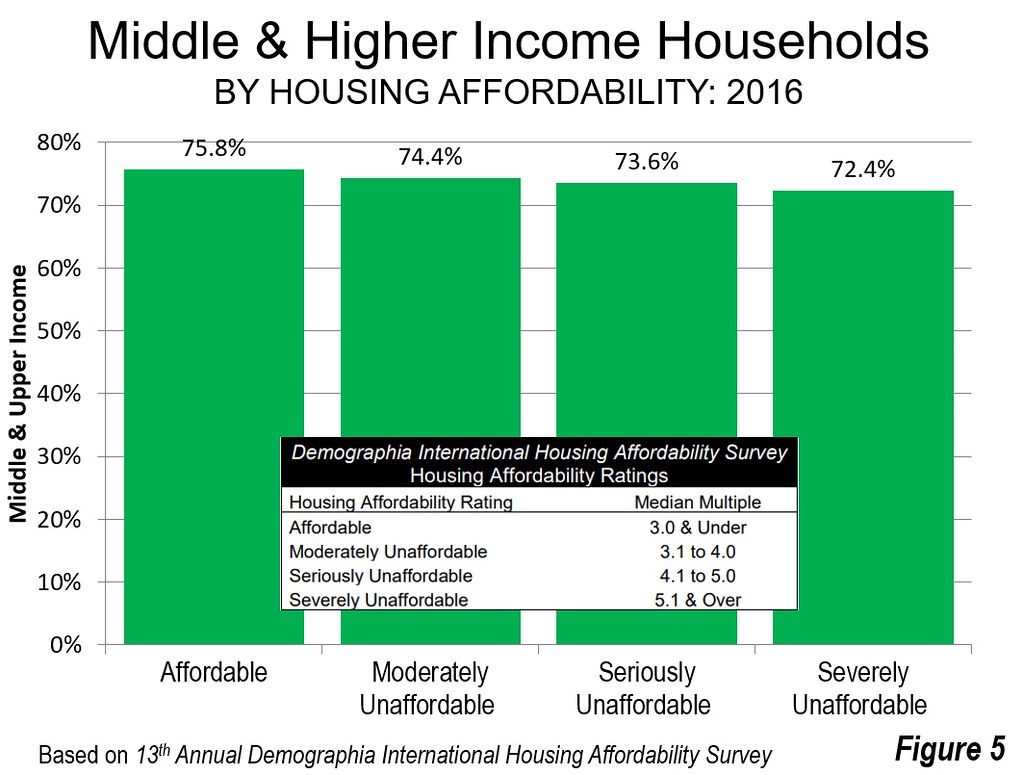
There is a strong positive relationship between a larger middle and upper income share of the population and better housing affordability (Figure 5). This is consistent with a growing body of economic research that has found an association between higher housing costs and lower economic growth (Note). The “Affordable” markets, as rated in the 13th Annual Demographia International Housing Affordability Survey had a middle and upper income share of households of 75.8%, 3.4 percentage points higher than the “severely unaffordable” markets. This is the equivalent of 3.1 million residents based on the population of the “severely unaffordable” markets.
An Important Step Forward
Adjustment for the cost of living greatly increases estimates of the extent of middle and upper income households. The cities with larger middle and upper income percentages offer much broader opportunity, which arises from the interplay of many factors, such as metropolitan markets and public policy, whether federal, state, regional and local within the metropolitan area. Even so, further refinements are needed:
1) The effect of federal, state and local taxation needs to be included. Including these taxes would more accurately reflect the higher cost of living of metropolitan areas in high-taxed states, such as California, New York, New Jersey Minnesota and Oregon:
2) The costs of owner occupied housing needs to be included. By their exclusion of owned housing costs, the BEA RPPs (on which Pew Research appropriately relies), overstate the number of middle-income and higher-income households in the metropolitan areas of states with the highest housing costs, especially Calfornia.. This is illustrated by the C2ER cost of living index, which has been widely used for decades and includes the cost of owned housing. For example, the C2ER cost of living for San Diego is a quarter higher than the BEA RPPs.
Nonetheless the new Pew Research data is a monumental step forward in comparing how well people live in American cities. Despite this important contribution, there is a continuing need to more accurately define households by income classification.
Note: For example, Chang-Tai Hseih of the University of Illinois, Chicago and Enrico Moretti of the University of California, Berkeley traced a nearly 10% annual loss in U.S. national output by 2009 from the expansion of housing regulation and the attendent upward impact on house prices from the mid-1960s. Kyle Herkenhoff of the University of Minnesota, Edward Ohanian of U.C.L.A. and Lee Prescott of Arizona State University estimate that if California’s land use regulatory structure were returned to the more market oriented situation of 1980, it “would increase national output, productivity “by about 1.5%.” Matthew Rognlie, now of Northwestern University, found that the widening inequality gap found by French economist Thomas Piketty was largely due to housing and suggested re-examining land-use regulation.
Wendell Cox is principal of Demographia, an international public policy and demographics firm. He is a Senior Fellow of the Center for Opportunity Urbanism (US), Senior Fellow for Housing Affordability and Municipal Policy for the Frontier Centre for Public Policy (Canada), and a member of the Board of Advisors of the Center for Demographics and Policy at Chapman University (California). He is co-author of the "Demographia International Housing Affordability Survey" and author of "Demographia World Urban Areas" and "War on the Dream: How Anti-Sprawl Policy Threatens the Quality of Life." He was appointed to three terms on the Los Angeles County Transportation Commission, where he served with the leading city and county leadership as the only non-elected member. He served as a visiting professor at the Conservatoire National des Arts et Metiers, a national university in Paris.
Photograph: Minneapolis-St. Paul (with the largest middle & upper income household share), suburbs and Interstate 494 Ring Road (by author).


