
The Brookings Institution is again out with data on the world’s most affluent metropolitan areas. The GDP data is in Redefining Global Cities, which contains a treasure trove of data. Again, United States metropolitan areas dominate the highest rankings, capturing nine of the top 10 positions. San Jose is rated with the highest gross domestic product (GDP) per capita, at $91,400 (purchasing power parity or PPP). This is an improvement from third in 2014 and second in 2012 (Figure 1). The top 10 is dominated by cities with relatively low urban densities, like those that characterize San Jose (core of the world’s leading information technology center , Silicon Valley).
In 2015, San Jose finally passed even less dense Hartford, which had ranked second and first in the two previous reports. In 2014, Macau, the smaller of China’s two Special Administrative Regions (SAR) had ranked number one (the larger SAR is Hong Kong, ranked 32nd). There was a methodology change in 2015 that established a population threshold higher than that of Macau, however the government’s anti-corruption campaign was credited with reducing Macao’s gaming revenue substantially and dropping the GDP per capita by about 15 percent. If it had been rated, Macau’s GDP per capita would have remained in the top 10, but would have fallen from the top.
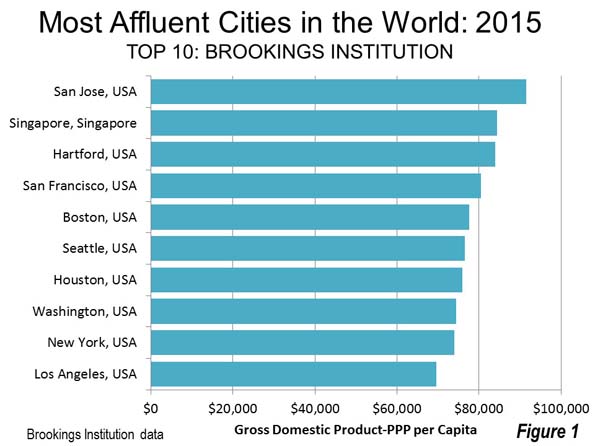
Singapore broke into the top 10, positioning itself between San Jose and Hartford, rising from 14th place, with a GDP per capita of $84,300. The Hartford, metropolitan area, which lead the list in 2012 and ranks second in 2014 fell to third place, with a GDP per capita of $84,000. San Francisco rose from nine in 2014 to 4th, with a GDP per capita of $80,600. Boston ranked fifth, with the GDP per capita of $77,700, dropping from fourth place. The top 10 was rounded out by Seattle, Houston, Washington, New York and Los Angeles (Note 1).
The US dominance was far less in the second 10, with positions 11, 12 and 13 being captured by Zurich, Perth (Australia) and Munich. Paris, often rated highly as a world city, ranked 17th, while Stockholm ranked 19th. The five US entries were Portland (14th), San Diego (16th), Minneapolis St. Paul (17th), Dallas-Fort Worth (18th), and Denver (20th).
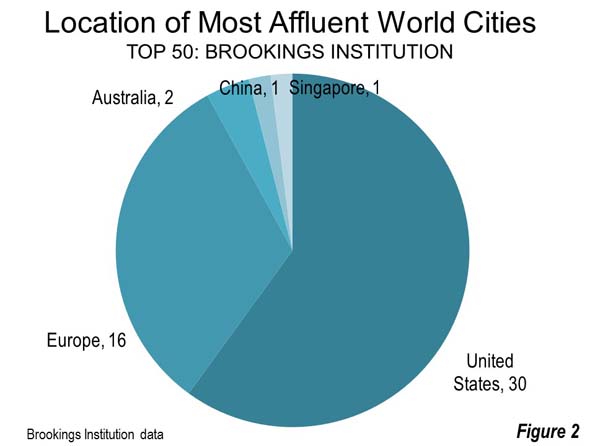
Thirty of the 50 most affluent cities were in the United States, and 16 were in Europe. Australia had two entries, while East Asia had two, Singapore and Hong Kong (Figure 2).
As usual, the rankings produced results that would surprise people who do not regularly follow this data. London, which is routinely in a neck and neck competition with New York as the strongest “world” city ranked 35th, just behind Columbus Ohio. Tokyo, home of the world’s largest urban area, ranked 60th, behind Shenzhen, China (59th). Toronto, Canada’s principal city, ranked 53rd, just behind San Antonio. Sydney, Australia’s largest city ranked 47th, just behind St. Louis and just ahead of Detroit.
Expanded Contents: Redefining Global Cities
The new Brookings Institution report contains far more data than is indicated above. There is labor productivity data, indicated by GDP per worker. San Jose also leads in this category, and again, nine US metropolitan areas are included in the top 10. The only non-US entrant is the industrial powerhouse of Dongguan, China, one of the world’s least known metropolitan areas, located between Hong Kong, Shenzhen, Guangzhou and Foshan (the latter three municipalities in Guangdong Province).
The report also contains data on economic growth, tradable clusters, innovation, talent and connectivity (with multiple indictors in each category). With the three reports since 2012, the Brookings Institution has positioned itself as a premier source for regularly published world urban data.
The Highest Productivity in the Lowest Urban Densities
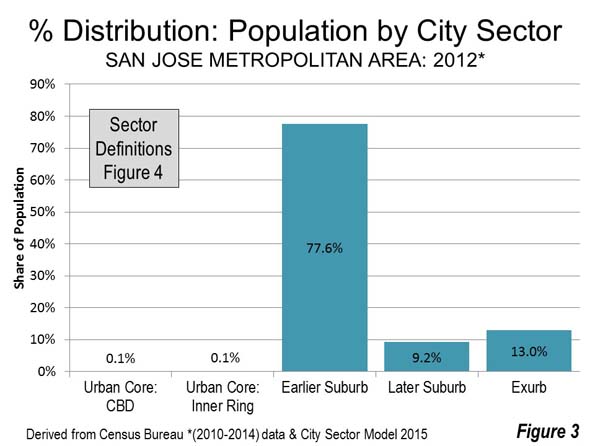
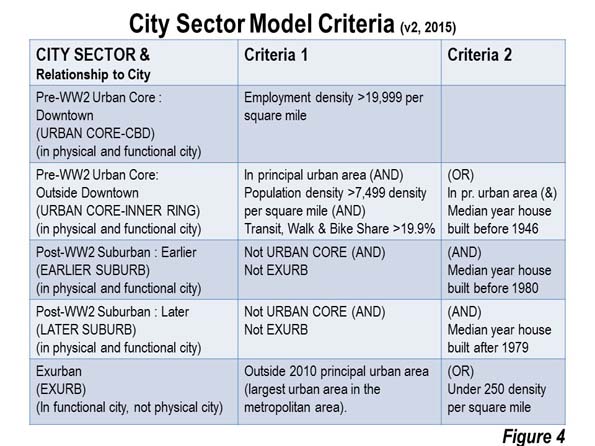
There have often been suggestions that productivity and innovation are associated with high urban densities. This year’s data provides ample refutation of any such claim. San Jose, the top city in both GDP per capita and labor productivity, is virtually all suburban, as is indicated by the City Sector Model (Figures 3 and 4). San Jose, without a pre-World War II core and world-class dispersion is illustrated in the photograph at the top.
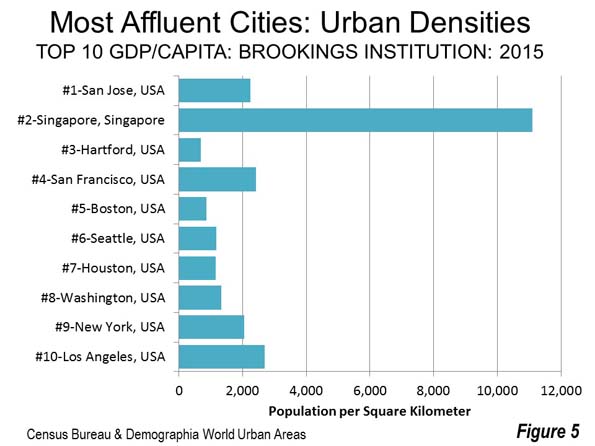
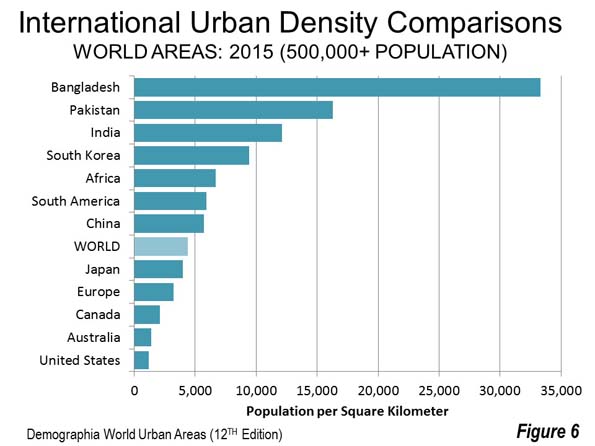
The highest built-up urban area density among the top 10 metropolitan areas in GDP per capita is in Singapore, which is also the only one exceeding the world average urban density in the top 30. All of the US metropolitan areas in the top 10 have urban population densities well below that of Singapore (Figure 5) and below that of the average Chinese and Western European urban areas. Indeed, US metropolitan areas, which dominate world affluence, have the lowest urban population densities in the world as is indicated in Figure 6 (Note 2).
Note 1: US city data not adjusted for PPP (regional price parities) within the United States. Application of regional price parities to personal or household incomes would yield considerably different rankings.
Note 2: Built -up urban area data are the only reliable measure for comparing urban densities at the organic city level, which in the economic or functional sense is metropolitan areas, and in the physical sense is contiguous built-up urban areas . This excludes the administrative unit or “municipality,” which is simply a political construct. For further information see: Paul Cheshire, Max Nathan and Henry G. Overman of the London School of Economics in their recent book, Urban Economics and Urban Policy: Challenging Conventional Policy Wisdom. Virtually all metropolitan areas contain a principal built-up urban area and extensive rural areas (commuting sheds), which may also contain smaller urban areas. Thus, any comparison of metropolitan densities is not an urban comparison, but a mix of urban and rural densities. In most of the few countries that designate metropolitan areas, the rural land areas are substantially greater than the urban land areas. The matter is further complicated by the lack of international “building block” standards for metropolitan areas. These standards produce hugely different mixes of urban and rural in metropolitan areas. For example, the New York urban area represents only 42 percent of the land area. In Riverside-San Bernardino, the principal urban area has 2 percent of the metropolitan land area. In Paris, the land outside the principal urban area represents 83 percent of the metropolitan area. A recent post in the respected Marginal Revolution blog (“China Fact of the Day”) indicated that China’s metropolitan area densities were lower than those of the United States. As noted above, metropolitan density comparisons are not reflective of urban densities. China’s urban densities are nearly five times that of US urban areas (Figure 5).
Wendell Cox is principal of Demographia, an international public policy and demographics firm. He is a Senior Fellow of the Center for Opportunity Urbanism (US), Senior Fellow for Housing Affordability and Municipal Policy for the Frontier Centre for Public Policy (Canada), and a member of the Board of Advisors of the Center for Demographics and Policy at Chapman University (California). He is co-author of the "Demographia International Housing Affordability Survey" and author of "Demographia World Urban Areas" and "War on the Dream: How Anti-Sprawl Policy Threatens the Quality of Life." He was appointed to three terms on the Los Angeles County Transportation Commission, where he served with the leading city and county leadership as the only non-elected member. He served as a visiting professor at the Conservatoire National des Arts et Metiers, a national university in Paris.
Photo by Michael from San Jose, California, USA (Santa Clara Valley - California) [CC BY 2.0], via Wikimedia Commons


