In Los Angeles County, the nation’s most populous and core of the nation’s most densely populated urban area, transit commuting is dropping fastest in areas with the most comprehensive transit service. This is illustrated by an examination of the 5-year trend from 2008-2012 (middle year 2010) to 2013-2017 (middle year 2015) for Public Use Microdata Areas (PUMAs). The “Koreatown” PUMA experienced a transit commuting market share decline of 14.1%, while East Los Angeles, long one of the better transit ridership areas, fell 36.7%. By contrast, transit commuting dropped 11.2% over the five past years in all of Los Angeles County.
PUMAs are analysis zones designated by the Census Bureau that divide the United States into areas of similar population, averaging 130,000. There are 69 PUMAs in Los Angeles, county, with an average population of 145,000 (2010). PUMAs are particularly useful for examining data within large jurisdictions, such as the city of Los Angeles, which with its nearly 4,000,000 residents combine high transit commuting neighborhoods as well as neighborhoods with small transit shares.
Koreatown: Strongest Los Angeles Transit Area, Densest Outside New York
The Koreatown PUMA is formally titled the “Los Angeles County (Central) — Central/Koreatown,” denoting that it is the Koreatown part of the central area in the city of Los Angeles, in the central part of Los Angeles County. Its perimeter is bounded generally by Pico Boulevard, Western Avenue, Beverly Boulevard and Hoover Street (Map).
The Koreatown PUMA had a population of 113,000, according to the 2010 Census and covers 2.9 square miles. Among the nation’s nearly 2.400 PUMAs, Koreatown ranks 27th in density (2010), with nearly 40,000 residents per square mile. The Koreatown PUMA is denser than all PUMAs in the nation but for 26 New York City (all in the four densest boroughs and excepting Staten Island).
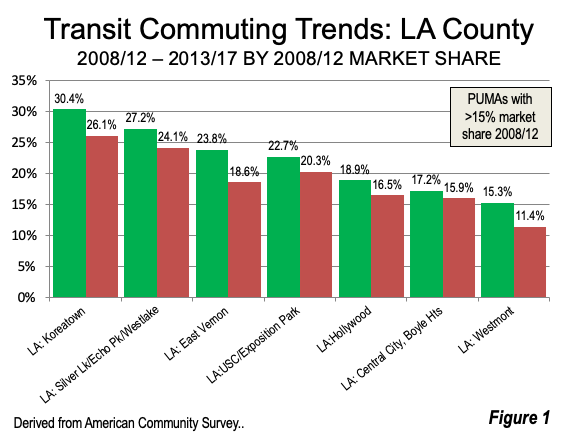
The Koreatown PUMA is home of the Wilshire/Vermont subway station, the only station in Los Angeles County that provides access to two subway routes (the Red Line from Union Station to North Hollywood and the Purple Line, which continues west along Wilshire Boulevard to Western Avenue). With this such a high density and such intense transit service, it is not surprising that the Koreatown PUMA has the highest transit work trip market share in Los Angeles County, at 30.1% in 2008/2017 (Figure 1).
Yet, the trend is surprisingly strongly downward. In 2013/2017, the transit work trip market share in the Koreatown PUMA was down to 26.1% by 2013/2017. Even with this big loss, Koreatown retained its lead in transit market share.
Other Strong Transit Areas
The second ranked Silver Lake/Echo Park/Westlake PUMA fell from a 27.2% transit work trip market share in 2008/2012 to 24.1% in 2013/2017, a loss of 11.5%.
All of the PUMAs that had a transit market share above 10% in 2008/2012 suffered losses to 2013/2017. This includes USC/Exposition Park PUMA, which is served by the new Expo rail line and the Central City/Boyle Heights PUMA, which is where all of the rail lines in Los Angeles County converge except for the I-105 Green Line (Figure 2).
The largest loss among these was in one of the areas with a historic rate of high transit ridership, East Los Angeles. The East Los Angeles PUMA experienced a 36.7% transit market share loss, falling from 14.1% in 2008/2012 to 8.9% in 2013/2017.
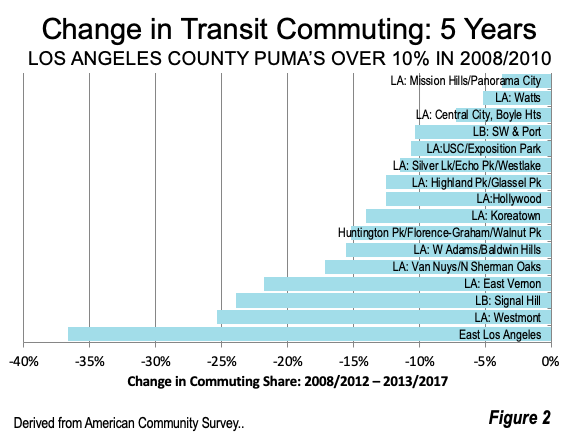
All 35 PUMAs with 4.5% or greater transit market shares in 2008/2012 lost commuters over the next five years.
Transit Commuting Losses Concentrated in Strongest Areas
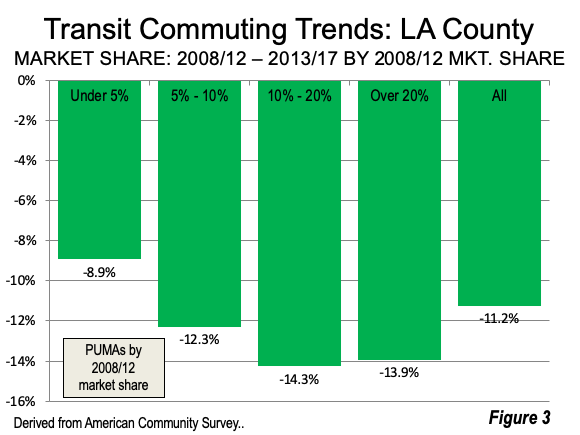
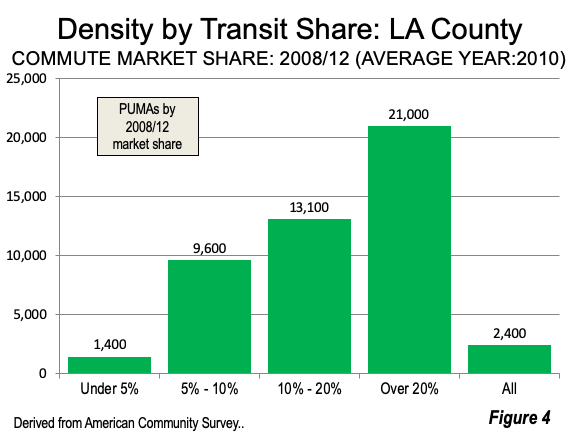
The concentration of transit commuting losses is illustrated by 2008/2012 market share categories and their change to 2013/2017. Among PUMAs with a 20% or more market share in 2008/2012, there was a 13.9% drop. PUMA’s with 10% to 20% market shares dropped by 14.9%. Those with from 5% to 10% fell 12.2%. By far the smallest loss was among the PUMAs where transit market shares were under 5% in 2008/12 (Figure 3). This should be a “wake up” to any believing that rail transit reduces traffic congestion or that high-density makes transit more appealing. Transit ridership is dropping the most of LA’s highest density areas, where the demand for mobility is the greatest. Transit ridership is declining the least dense areas, where the demand for mobility is the least (Figure 4).
Why is this happening? In an earlier article we quoted a couple of findings:
U.C.L.A. authors, Michael Manville, Brian D. Taylor and Evelyn Blumenberg note in a report for the Southern California Association of Governments (SCAG) that: “Areas that were heavily populated with transit commuters in the year 2000 became, in the next 15 years, slightly less poor, and significantly less foreign born. Perhaps most important, the share of households without vehicles in these neighborhoods fell notably. All these factors align with a narrative where a transit-using populace is replaced by people who are more likely to drive.”
The theme was developed further by Tracy Jeanne Rosenthal of the Los Angeles Tenants Union, in a Los Angeles Times op-ed entitled: “Transit-oriented development? More like transit rider displacement.” Using evidence from Koreatown, Echo Park and other strong transit Los Angeles neighborhoods, she said “…transit in Los Angeles isn’t just suffering because of gentrification, it’s causing gentrification” (emphasis added).
Surprisingly to some, most low-income American workers predominantly commute by car, not by transit in all major metropolitan areas except New York. In Los Angeles (which includes Los Angeles and Orange counties), six times as many of the lowest income workers use cars as transit in Los Angeles.
Why is this so? Because for the most part, you cannot get from home to work by transit fast enough, in any major metropolitan area. The job access data developed University of Minnesota Accessibility Observatory shows that the average worker can reach 33 times (3,300%) as many jobs in 30 minutes by car as by transit in the Los Angeles metropolitan area (which includes both Los Angeles and Orange counties).
The concentration of work trip destinations that is required for a substantial transit commuting share simply does not exist. As Bumsoo Lee, now of the University of Illinois, and Peter Gordon at the University of Southern California have shown, more than 75%, on average, of jobs in the major metropolitan areas are dispersed --- not downtown and not even in suburban subcenters (edge cities). This includes New York.
The experience of Los Angeles County — with its dense urbanization and ideal weather — should be a warning to those, in California and elsewhere, who assume that high density, “transit oriented development” and substituting transit for driving alone naturally go together. In fact, they do not.
Note: My involvement as a member of the Los Angeles County Transportation Commission is detailed in Transit in Los Angeles
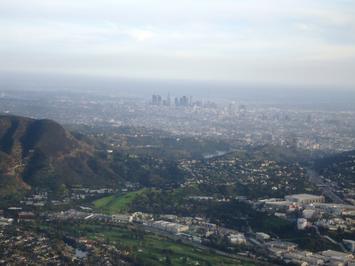
Photograph: Downtown Los Angeles from over North Hollywood (by author)
Wendell Cox is principal of Demographia, an international public policy and demographics firm. He is a Senior Fellow of the Center for Opportunity Urbanism (US), Senior Fellow for Housing Affordability and Municipal Policy for the Frontier Centre for Public Policy (Canada), and a member of the Board of Advisors of the Center for Demographics and Policy at Chapman University (California). He is co-author of the "Demographia International Housing Affordability Survey" and author of "Demographia World Urban Areas" and "War on the Dream: How Anti-Sprawl Policy Threatens the Quality of Life." He was appointed by Mayor Tom Bradley to three terms on the Los Angeles County Transportation Commission, where he served with the leading city and county leadership as the only non-elected member. Speaker of the House of Representatives appointed him to the Amtrak Reform Council. He served as a visiting professor at the Conservatoire National des Arts et Metiers, a national university in Paris.


