
America is still a mobile nation. Back in the 2000-2010 decade, 12.9 million people moved interstate, nearly five percent of the total population. In the 2010s the population has been a bit less mobile, with net domestic migration of 11.7 million residents, slightly under four percent. Nonetheless, 11.7 million is a large number. This is nearly equal to the population of Ohio, with only five states being larger (California, Texas, Florida, New York, Pennsylvania and Illinois). This article describes net domestic migration trends by state from 2000 to 2019 (Note).
Top Domestic Migration Population Gainers
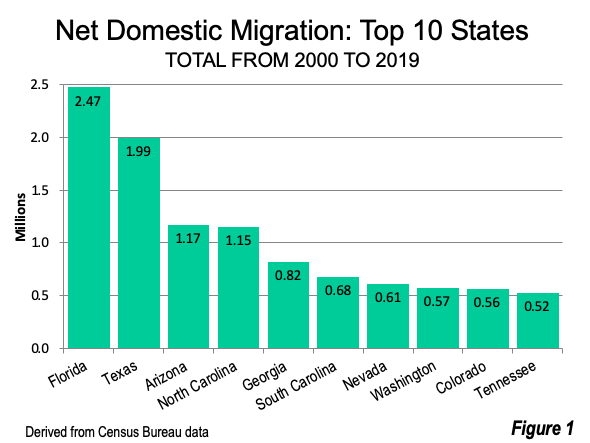
As has been the case with population growth for decades, states in the South and the West had the largest numbers of net domestic migrants. Six of the top ten states were in the South, and four were in the West. However, unlike in the middle to late decades of the 20th Century, California no longer ranks among the leaders.
Florida: Number 1 in Net Domestic Migration
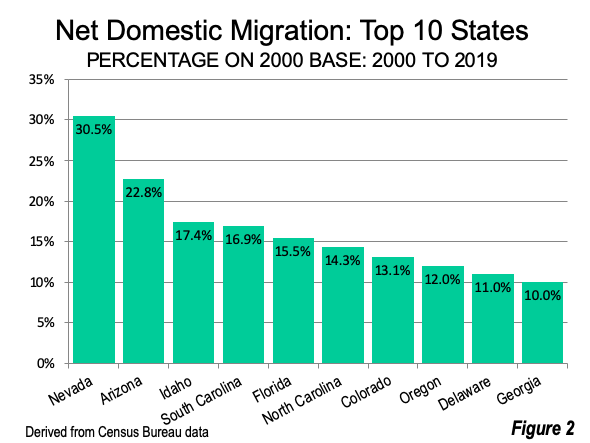
Florida and Texas attracted by far the largest number of new net domestic migrants over the past two decades (Figure 1). Florida added nearly 2.5 million residents from other states. This is more people than live in each of 18 states and the District of Columbia. Florida also placed fifth in its proportionate net domestic migration gain,—15.5%—in relation to its 2000 population (Figure 2).
Back in 2000, Florida had 15.3 million residents, and grew to 21.5 million by 2019. This 6.2 million increase propelled Florida to third place, ahead of New York, which grew from 18.3 million in 2000 to 19.4 million in 2019.
Texas: Number 2 in Net Domestic Migration
Texas, the nation’s second most populous state had the second largest gain in net domestic migration, at just below 2 million. During the two decades, the two largest Texas metropolitan areas, Dallas-Fort Worth and Houston moved from below the top five to positions four and five respectively.
Arizona and North Carolina: Over 1 Million Gains
Arizona had a net domestic migration gain of 1.2 million, the third largest gain. In proportional terms, Arizona was the second largest gainer, at 22.8% relative to its 2000 population. North Carolina nearly equaled Arizona’s population increase in numbers from domestic migration and had the sixth largest percentage gain (14.3%).
Other Top Population Gainers
Six other states added more than one-half million residents through net domestic migration. These included Georgia (820,000), South Carolina (680,000), Nevada (610,000), Washington (570,000), Colorado (560,000) and Tennessee (520,000).
Top Proportionate Gainers
Nevada had by far the largest proportionate gain in net domestic migration, at 30.5% relative to its 2000 population. Idaho and South Carolina placed third and fourth respectively, behind Arizona and ahead of Florida. Colorado, Oregon, Delaware and Georgia followed North Carolina (above), with proportionate gains of from 10.0% to 13.1%.
Again, all of the top proportionate gainers were in the South or West, with five from each region. Delaware, perhaps best seen as a border state, may be a surprise, because of its location in the Northeast Corridor (Washington to Boston), and its northernmost county (New Castle, with county seat Wilmington) in the Philadelphia metropolitan area. However, the net domestic migration gains in Delaware were all in its two other counties (Kent and Suffolk), which are well-positioned to attract relatively large numbers of movers from the nearby Washington, Baltimore and Philadelphia metropolitan areas, which shed nearly 600,000 net domestic migrants over the last two decades.
The Losers: Moving from New York and California
Five Northeastern states were among the 10 losing the most net domestic migrants from 2000 to 2019. In addition, three of the 10 greatest losses were in the Midwest, one in the West and one in the South.
Three states lost more than one million residents through net domestic migration. New York lost the most at 3.1 million (Figure 3). This is as many people as live in the states of Nevada or Arkansas. New York was also the largest proportional loser, at 16.2% of its 2000 population (Figure 4).
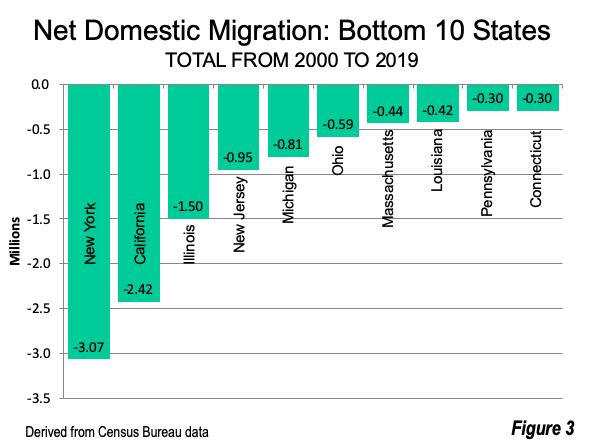
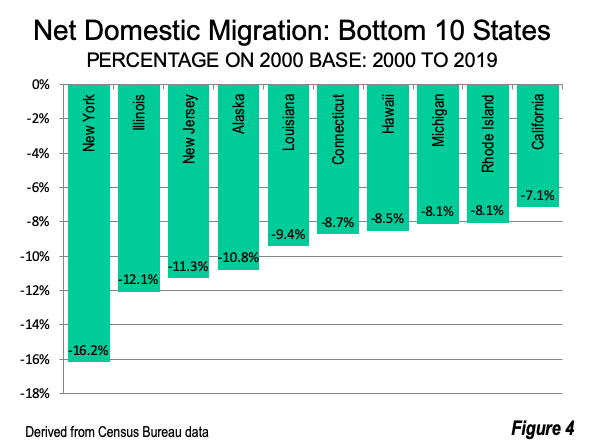
California was not far behind, losing 2.4 million residents by net domestic migration. This is more people than live in Houston, the nation’s fourth largest city. Due to having more than twice as many residents as New York, its proportional loss was much less, at 7.1%, ranking the tenth greatest in the nation.
Illinois lost the third most net domestic migrants (1.5 million) and had the second largest proportional loss, at 12.1% of its 2000 population.
New Jersey, which is largely split between the New York and Philadelphia metropolitan areas, suffered the fourth net domestic migration loss, at nearly one million. New Jersey placed third in proportional decline, at 11.3%.
Two other states lost more than 500,000 net domestic migrants, Michigan and Ohio. Massachusetts, Louisiana, Pennsylvania and Connecticut lost over 300,000 net domestic migrants. Louisiana’s huge loss can be largely attributed to the impacts of Hurricane Katrina, in the middle 2000s.
Other Proportional Losses
Four of the largest proportional losses were in Northeastern states, three were in the West, two in the Midwest and one in the South.
Outside of New York, Illinois and New Jersey, Alaska had the largest proportional loss, at 10.8%. Louisiana lost 9.4% of its population to net domestic migration, while Connecticut, Hawaii, Michigan and Rhode Island lost more than eight percent.
Trends
The future could see an acceleration of the trends noted above. The COVID-19 has produced all sorts of evidence that people are moving away from overcrowding and density (both residential and employment) and relying more on telework than on physical commutes, especially to the largest central business districts. This has shown than many people do not have to live within convenient daily commuting distance from employment locations, because their commutes are from one room to another. In 2019, more than one-third of intercounty net migration moves were employment related, according to the Current Population Survey. In the future, fewer people are likely to need to move to be closer to their jobs, because of a probably much higher rate of teleworking.
The biggest losses have taken place in the largest legacy downtowns: New York, Chicago, Philadelphia, San Francisco and Boston.
At the same time, housing considerations drove about one quarter of net domestic migration. Three of the states losing the most net domestic migrants from 2000 to 2020 have severely unaffordable metropolitan areas, according to the Demographia International Housing Affordability Survey. These include California (with Los Angeles, San Jose, San Francisco, San Diego, Riverside-San Bernardino, Sacramento, and Fresno), and New York and New Jersey, which includes nearly all of the New York metropolitan area.
The large net domestic migration losses in these states could well continue, due to increased teleworking and overly expensive housing. After COVID, Americans are again on the move, a trend that will impact our economy, politics and social future. It will be fascinating if new migration numbers surpass those of the past decade.
Note: The Census Bureau estimates net domestic migration trends, which are released with the annual population estimates. In both the 2000s and 2010s, data is provided from April (the decennial census date) of the “00” year through June of the “09” year (the end of the annual “estimate year”). As a result, no data is available for January through March 2000, July 2009 through March 2010 and June 2019 through December 2019.
Photograph: Chicago Loop, second largest US central business district, in the state with the second largest net domestic migration loss rate from 2000 to 2019 (by author).
Wendell Cox is principal of Demographia, an international public policy firm located in the St. Louis metropolitan area. He is a founding senior fellow at the Urban Reform Institute, Houston and a member of the Advisory Board of the Center for Demographics and Policy at Chapman University in Orange, California. He has served as a visiting professor at the Conservatoire National des Arts et Metiers in Paris. His principal interests are economics, poverty alleviation, demographics, urban policy and transport. He is co-author of the annual Demographia International Housing Affordability Survey and author of Demographia World Urban Areas.
Mayor Tom Bradley appointed him to three terms on the Los Angeles County Transportation Commission (1977-1985) and Speaker of the House Newt Gingrich appointed him to the Amtrak Reform Council, to complete the unexpired term of New Jersey Governor Christine Todd Whitman (1999-2002). He is author of War on the Dream: How Anti-Sprawl Policy Threatens the Quality of Life and Toward More Prosperous Cities: A Framing Essay on Urban Areas, Transport, Planning and the Dimensions of Sustainability.


