
China’s National Bureau of Statistics has just published freight transportation statistics for 2020. It tells much about China’s seemingly inexorable rise and its ties to the tangible economy. While different from most in the West, its stolidity and trajectory are fairly well-established.
Despite the pandemic and its associated economic interruption, freight volumes were little changed. Overall, total freight metric tonne kilometers (a metric tonne is equal to approximately 1.1 US tons, which are also called “short tons”) dropped only 1.0 percent in 2020 compared to 2019. This includes freight carried by trucks, rail, vessels on inland waterways and air cargo. The report did not provide data on pipelines. Freight volumes fared much better than passenger volumes, which dropped 45%.
China has enjoyed strong growth in freight volumes over the past decade (Figure 1). Since 2010 total freight carried (excluding pipelines) grew by an annual rate of 3.5 %. In 2010 China’s freight carriers moved 14 thousand billion tonne kilometers in 2010, a figure that increased to over 20 thousand billion in 2020 (assuming that pipelines carried a similar volume to 2019).
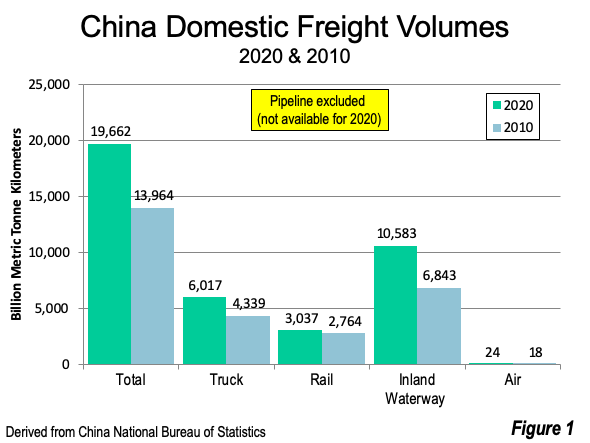
China’s inland waterways, including the historic Grand Canal, moved more than one-half of the freight, at more than 10.6 thousand billion tonne kilometers. Inland waterway volume has also risen more than the other modes, with a 55% increase from 2010. This is a 4.5% annual increase
With the world’s largest expressway (freeway) system, at 161,000 kilometers, approximately 50% more than in the United States, China’s truckers accounted for second largest share of freight movement, at 6 thousand billion tonne kilometers. This is a 39% increase from 2010 (3.3% annual increase).
Freight rail accounted for 3 thousand billion tonne kilometers and was the third leading mode. The increase in freight rail was 10% from 2010, or 0.9% annually.
Air cargo accounted for a much smaller 28 billion tonne kilometers, and grew 34% from 2010 to 2020. This is a 3.0 annual growth rate.
Comparison to the United States
China and the United States are the two strongest economies in the world. The United States retains a lead in nominal Gross Domestic Product (GDP), while China leads the Purchasing Power Parity (PPP) adjusted figures. World Bank data indicates that the US continues to lead in PPP adjusted GDP per capita, at nearly four times that of China. However, China is the undisputed leader in freight transport volumes, according to the last year for which US data is available (2018). China’s total freight volume was 20.5 thousand million metric tonnes (tonnes), 2.7 times that of the United States (Figure 2). This volume is driven by two factors, China as the world’s leading export nation, and China’s increasingly affluent population, which is four times that of the US.
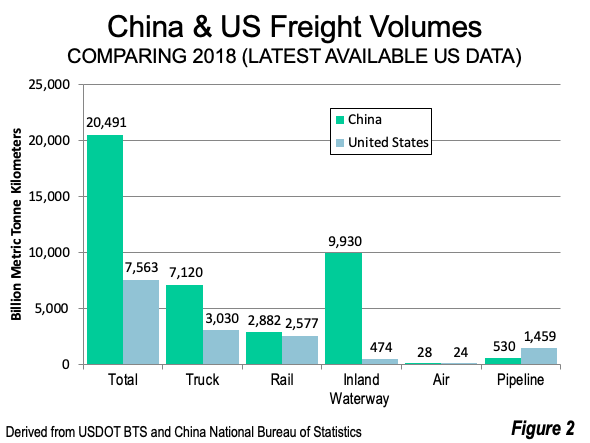
China’s biggest lead is in inland waterway volume, with 20 times the US volume. China’s trucks carry more than double the US volume. China’s rail freight and air cargo sectors have more narrow leads. The US leads strongly in pipelines, with 2.8 times China’s volume.
China’s freight volumes increased an average of 4.5% from 2010 to 2018, compared to the US figure of 0.8%.
The Future?
The World Bank is bullish on the Chinese economy, having predicted 7.9% GDP growth in 2021. If that is achieved, it seems likely that freight volumes will also increase. Some may look down on the prosaic business of making and shipping goods, but China’s rise is best seen by looking at the rising affluence of its middle-class and substantial reduction in poverty that are the principal domestic results. (See: Alleviating World Poverty: A Progress Report).
Wendell Cox is principal of Demographia, an international public policy firm located in the St. Louis metropolitan area. He is a founding senior fellow at the Urban Reform Institute, Houston, a Senior Fellow with the Frontier Centre for Public Policy in Winnipeg and a member of the Advisory Board of the Center for Demographics and Policy at Chapman University in Orange, California. He has served as a visiting professor at the Conservatoire National des Arts et Metiers in Paris. His principal interests are economics, poverty alleviation, demographics, urban policy and transport. He is co-author of the annual Demographia International Housing Affordability Survey and author of Demographia World Urban Areas.
Mayor Tom Bradley appointed him to three terms on the Los Angeles County Transportation Commission (1977-1985) and Speaker of the House Newt Gingrich appointed him to the Amtrak Reform Council, to complete the unexpired term of New Jersey Governor Christine Todd Whitman (1999-2002). He is author of War on the Dream: How Anti-Sprawl Policy Threatens the Quality of Life and Toward More Prosperous Cities: A Framing Essay on Urban Areas, Transport, Planning and the Dimensions of Sustainability.
Lead image: Grand Canal in Suzhou, Jiangsu, by author.


