
The share of workers commuting to work by auto fell to 75.6%, according to the 2021 American Community Survey (ACS), the lowest level since before the 1970 census, which reported that 77.7% of commuting was by auto (Figure 1). At the beginning of the previous decade, in 1960, autos accounted for 64.0% of commuting.
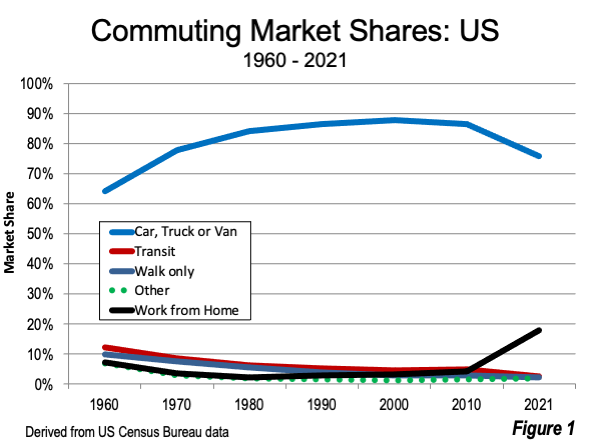
The new data provides the first comprehensive look at how work access (commuting) was revolutionized between the last pre-pandemic year (2019) and 2021 (Figure 2). The most important factor in reducing commuting by auto was the pandemic, with its severe lockdowns, and the related business closures.
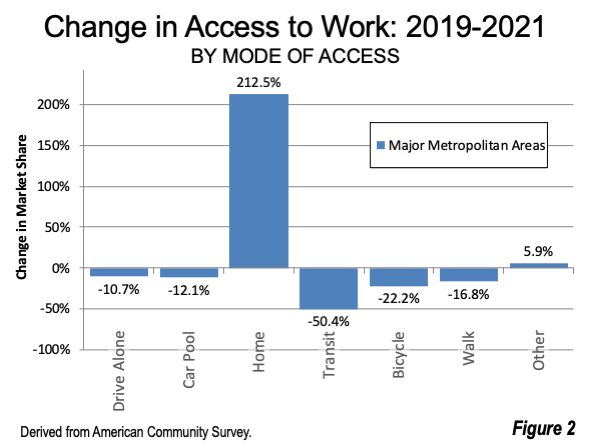
The share of commuters working from home increased by more than 200%, while transit’s share dropped about 50%. While working at home was increasing by 18.6 million from 2019 to 2021 (Figure 2), car commuting dropped 14.5 million, transit commuting declined 4.0 million, and the total number of commuters dropped 2.6 million.
Auto Commuting
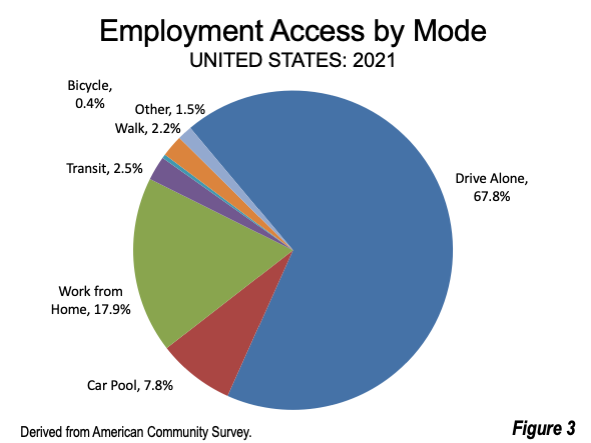
Despite the recent decline, auto commuting remained the dominant commuting mode nationally, as it has since the first Census Bureau report in 1960. Separate drive alone figures were first reported in the 1980 census, and have dominated the market since then. In 2021, the drive alone market share was 67.8%, 16.8% under the 2019 figure (75.1%). The 2021 market shares are in Figure 3.
Working from Home Employment Access
As expected, working from home expanded significantly, spurred by business lockdowns. The share of working at home in the United States, grew from 5.7% in 2019 to 17.9% in 2021. In 2021, 27.6 million workers worked from home, compared to 9.0 million in 2019. This made working from home the second largest method of work access, displacing car pools.
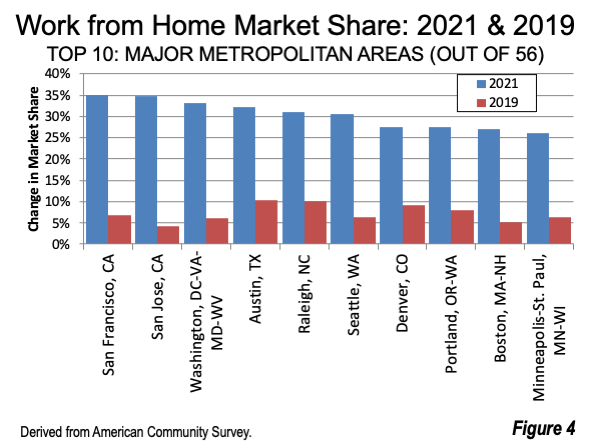
There was a substantial range in working from home among the 56 major metropolitan areas (over 1,000,000 population), from little over 10% to 35%. The intensity of the working from home revolution is illustrated by the fact that the lowest 2021 rates are higher than the top 2019 rates. The highest rate in 2019 was 10.3%, in Austin, while the lowest 2021 rate was Honolulu‘s 10.9%.
The highest 2021 work from home share was in San Francisco, at 35.1%, more than four times the 2019 figure of 6.9%. San Jose nearly equaled San Francisco, at 34.8%, more than eight times 2019 (4.2%). Washington, DC-VA-MD-WV, Austin, Raleigh and Seattle also had work from home shares exceeding 30%. Denver, Portland, Boston, Minneapolis-St. Paul and Charlotte exceeded 25% (Figure 4). The metros with the largest working from home shares are overwhelmingly tech and finance hubs.
The lowest 2021 work from home share was in Honolulu, at 10.9%, nearly three times its 2019 share. Fresno, Memphis, New Orleans, Oklahoma City and Tulsa had working at home shares of under 12.5% (Figure 5).
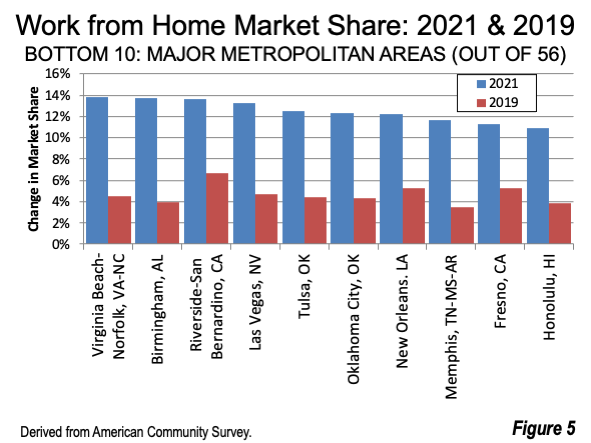
In each of the 56 cases, the working at home market share at least doubled over the past year, with the smallest gain in Riverside-San Bernardino. San Jose had the largest increase, at over 700%. In all 56 metros, the working from home share was greater than the car pool share in 2021 (Table 1).
Transit Employment Access
At the same time there were unprecedented declines in transit commuting from 2019 to 2021. The largest losses were in San Jose (minus 80%), San Francisco, Seattle, Tulsa and Washington (69.2%), shown in Table 2.
The highest transit market share was in New York, at 19.0%, down 40% from 31.7% in 2019. Boston was a distant second, at 5.6%, down 57% from 2019. San Francisco, which had been the second strongest transit market in 2019, dropped 73% from 18.1% in 2019 to 4.9% in 2021. The other three metros with transit legacy cities ranked in the top seven, including Chicago, Philadelphia and Washington, followed by Seattle. Honolulu, one of the three major metros that has recently passed one million population, ranked sixth highest (Figure 6).
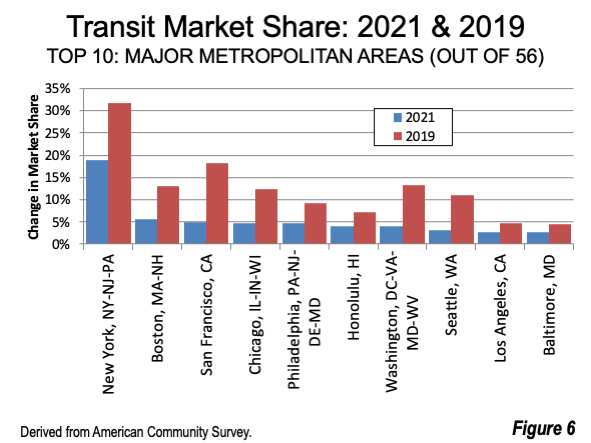
Los Angeles achieved its highest ranking in transit share ever reported in Census the data, ranking 9th, with a market share of 2.8%, even with a 41% decline in the last two years. In 2019, Los Angeles ranked 12th, and has since passed Portland, Baltimore and Pittsburgh. Baltimore and Buffalo exceeded 2.5%. Portland, often touted for its light rail system, fell four places from 9th to 13th between 2019 and 2021 and had a 2.3% transit share.
Only in New York and Boston was the transit share above that of car pools. By contrast transit led car pools in the six metros with legacy cities (New York, Chicago, Philadelphia, San Francisco, Boston and Washington) as well as Seattle in 2019. These seven metros have the largest estimated central business district (CBD or downtown) employment, each with more than 200,000 jobs and a transit market share of more than 40% (Table 2).
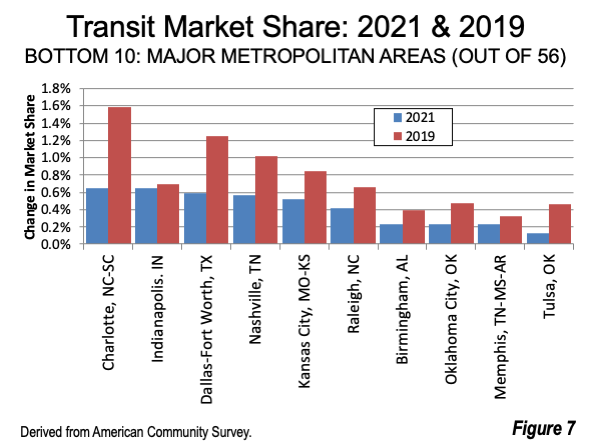
The 10 major metros with the smallest 2021 transit market shares have less than a 0.7% share (Figure 7).
The New Normal: Still Developing
Within just two years (2019-2021), those working at home rose to 3.5 times the highest transit commuting ever reported by the Census Bureau (7.8 million in 1960). In 2021, working from home accounted for more than seven times transit commuting.
Later research indicates that the high working from home share is continuing. Jose Maria Barrero of Instituto Tecnologico Autonomo de México, Stanford’s Nicholas Bloom, and Steven J. Davis of the University of Chicago estimated that from April to August of 2022, 30% of work days were from home. Professor Bloom told The Wall Street Journal that this figure has “held steady — despite recent campaigns by many employers to get staff to work from the office more often.”
At the same time, while transit ridership is rising, it is still well below 2019 levels. There are expectations that it will take some time for transit to recover its 2019 ridership levels. This is illustrated in projections for New York and San Francisco, the two strongest transit markets as of 2019.
We may not yet be at the “new normal,” but the future seems likely to involve less physical commuting and more virtual work access as technology continues to advance.
Wendell Cox is principal of Demographia, an international public policy firm located in the St. Louis metropolitan area. He is a founding senior fellow at the Urban Reform Institute, Houston, a Senior Fellow with the Frontier Centre for Public Policy in Winnipeg and a member of the Advisory Board of the Center for Demographics and Policy at Chapman University in Orange, California. He has served as a visiting professor at the Conservatoire National des Arts et Metiers in Paris. His principal interests are economics, poverty alleviation, demographics, urban policy and transport. He is co-author of the annual Demographia International Housing Affordability Survey and author of Demographia World Urban Areas.
Mayor Tom Bradley appointed him to three terms on the Los Angeles County Transportation Commission (1977-1985) and Speaker of the House Newt Gingrich appointed him to the Amtrak Reform Council, to complete the unexpired term of New Jersey Governor Christine Todd Whitman (1999-2002). He is author of War on the Dream: How Anti-Sprawl Policy Threatens the Quality of Life and Toward More Prosperous Cities: A Framing Essay on Urban Areas, Transport, Planning and the Dimensions of Sustainability.
Photo: San Francisco Bay Area rail system map. This area includes the San Francisco and San Jose metropolitan areas, which in 2021 had the strongest major metro work from home share in the nation. Source: Wikimedia under CC 2.0 License.
Table 1 (back to reference)
| Table 1 | ||||||
| Work from Home Employment Access by Major Metropolitan Area | ||||||
| 2019-2021 (Usual Method of Work Access) | ||||||
| Major Metropolitan Area | 2021 | Rank | 2019 | Rank | Change | Rank |
| Atlanta, GA | 24.2% | 12 | 8.7% | 4 | 176.6% | 49 |
| Austin, TX | 32.2% | 4 | 10.3% | 1 | 213.2% | 34 |
| Baltimore, MD | 22.2% | 20 | 5.5% | 29 | 300.6% | 14 |
| Birmingham, AL | 13.7% | 48 | 3.9% | 53 | 246.8% | 24 |
| Boston, MA-NH | 26.9% | 9 | 5.3% | 33 | 411.6% | 3 |
| Buffalo, NY | 14.3% | 45 | 3.5% | 56 | 313.2% | 9 |
| Charlotte, NC-SC | 25.3% | 11 | 7.9% | 9 | 220.6% | 28 |
| Chicago, IL-IN-WI | 21.5% | 22 | 5.7% | 27 | 278.6% | 17 |
| Cincinnati, OH-KY-IN | 17.1% | 37 | 5.4% | 31 | 217.1% | 33 |
| Cleveland, OH | 16.5% | 38 | 4.6% | 43 | 260.2% | 20 |
| Columbus, OH | 23.0% | 17 | 5.3% | 34 | 337.4% | 8 |
| Dallas-Fort Worth, TX | 20.7% | 26 | 6.5% | 17 | 218.7% | 31 |
| Denver, CO | 27.5% | 7 | 9.2% | 3 | 199.9% | 40 |
| Detroit, MI | 19.8% | 30 | 4.4% | 49 | 348.7% | 7 |
| Fresno, CA | 11.2% | 55 | 5.3% | 32 | 112.3% | 55 |
| Grand Rapids, MI | 13.9% | 46 | 4.6% | 44 | 203.7% | 37 |
| Hartford, CT | 20.3% | 28 | 5.0% | 37 | 303.5% | 11 |
| Honolulu, HI | 10.9% | 56 | 3.9% | 54 | 181.3% | 47 |
| Houston, TX | 15.5% | 42 | 5.1% | 36 | 202.2% | 38 |
| Indianapolis. IN | 17.7% | 36 | 5.5% | 30 | 220.1% | 29 |
| Jacksonville, FL | 17.9% | 33 | 7.5% | 10 | 139.7% | 53 |
| Kansas City, MO-KS | 20.0% | 29 | 6.3% | 21 | 219.0% | 30 |
| Las Vegas, NV | 13.3% | 50 | 4.7% | 42 | 183.4% | 45 |
| Los Angeles, CA | 21.2% | 24 | 6.1% | 23 | 249.5% | 22 |
| Louisville, KY-IN | 15.4% | 43 | 4.8% | 40 | 217.2% | 32 |
| Memphis, TN-MS-AR | 11.7% | 54 | 3.5% | 55 | 233.9% | 26 |
| Miami, FL | 16.1% | 39 | 6.3% | 20 | 156.5% | 51 |
| Milwaukee,WI | 17.9% | 35 | 4.4% | 48 | 302.1% | 13 |
| Minneapolis-St. Paul, MN-WI | 26.0% | 10 | 6.4% | 18 | 308.1% | 10 |
| Nashville, TN | 20.6% | 27 | 7.4% | 11 | 176.9% | 48 |
| New Orleans. LA | 12.2% | 53 | 5.2% | 35 | 133.9% | 54 |
| New York, NY-NJ-PA | 22.8% | 19 | 4.7% | 41 | 384.3% | 5 |
| Oklahoma City, OK | 12.3% | 52 | 4.4% | 51 | 182.5% | 46 |
| Orlando, FL | 19.0% | 31 | 6.6% | 16 | 187.3% | 43 |
| Philadelphia, PA-NJ-DE-MD | 23.6% | 13 | 6.0% | 24 | 295.7% | 15 |
| Phoenix, AZ | 23.4% | 14 | 7.9% | 6 | 194.2% | 42 |
| Pittsburgh, PA | 21.1% | 25 | 5.7% | 28 | 271.9% | 19 |
| Portland, OR-WA | 27.5% | 8 | 7.9% | 7 | 247.6% | 23 |
| Providence, RI-MA | 15.8% | 41 | 4.5% | 47 | 252.3% | 21 |
| Raleigh, NC | 31.0% | 5 | 10.2% | 2 | 204.7% | 36 |
| Richmond, VA | 23.0% | 16 | 5.7% | 26 | 302.9% | 12 |
| Riverside-San Bernardino, CA | 13.6% | 49 | 6.7% | 15 | 103.7% | 56 |
| Rochester, NY | 15.3% | 44 | 4.5% | 46 | 237.6% | 25 |
| Sacramento, CA | 23.3% | 15 | 7.9% | 8 | 195.8% | 41 |
| St. Louis,, MO-IL | 18.7% | 32 | 5.0% | 38 | 272.9% | 18 |
| Salt Lake City, UT | 22.9% | 18 | 5.9% | 25 | 291.8% | 16 |
| San Antonio, TX | 15.8% | 40 | 4.9% | 39 | 225.7% | 27 |
| San Diego, CA | 22.1% | 21 | 7.4% | 12 | 200.7% | 39 |
| San Francisco, CA | 35.1% | 1 | 6.9% | 13 | 409.2% | 4 |
| San Jose, CA | 34.8% | 2 | 4.2% | 52 | 727.0% | 1 |
| Seattle, WA | 30.6% | 6 | 6.3% | 19 | 384.2% | 6 |
| Tampa-St. Petersburg, FL | 21.2% | 23 | 8.6% | 5 | 145.8% | 52 |
| Tucson, AZ | 17.9% | 34 | 6.9% | 14 | 160.8% | 50 |
| Tulsa, OK | 12.5% | 51 | 4.4% | 50 | 185.8% | 44 |
| Virginia Beach-Norfolk, VA-NC | 13.8% | 47 | 4.5% | 45 | 205.3% | 35 |
| Washington, DC-VA-MD-WV | 33.1% | 3 | 6.1% | 22 | 442.1% | 2 |
| Derived from American Community Survey, 2019.& 2021 | ||||||
Table 2 (back to reference)
| Table 2 | ||||||
| Transit Employment Access by Major Metropolitan Area | ||||||
| 2019-2021 (Usual Method of Work Access) | ||||||
| Major Metropolitan Area | 2021 | Rank | 2019 | Rank | Change | Rank |
| Atlanta, GA | 1.0% | 32 | 2.7% | 23 | -63.5% | 50 |
| Austin, TX | 0.7% | 43 | 1.9% | 30 | -62.9% | 49 |
| Baltimore, MD | 2.6% | 10 | 4.6% | 14 | -43.5% | 32 |
| Birmingham, AL | 0.2% | 53 | 0.4% | 55 | -40.7% | 26 |
| Boston, MA-NH | 5.6% | 2 | 13.1% | 4 | -57.2% | 41 |
| Buffalo, NY | 2.5% | 11 | 2.9% | 17 | -11.4% | 3 |
| Charlotte, NC-SC | 0.7% | 47 | 1.6% | 39 | -58.9% | 42 |
| Chicago, IL-IN-WI | 4.8% | 4 | 12.3% | 5 | -61.0% | 45 |
| Cincinnati, OH-KY-IN | 0.9% | 34 | 1.5% | 40 | -38.0% | 19 |
| Cleveland, OH | 1.4% | 24 | 2.8% | 22 | -49.5% | 37 |
| Columbus, OH | 0.9% | 35 | 1.6% | 37 | -43.2% | 31 |
| Dallas-Fort Worth, TX | 0.6% | 49 | 1.2% | 44 | -52.8% | 40 |
| Denver, CO | 1.7% | 20 | 4.6% | 13 | -62.8% | 48 |
| Detroit, MI | 0.9% | 36 | 1.4% | 41 | -34.4% | 14 |
| Fresno, CA | 0.8% | 39 | 1.1% | 47 | -23.6% | 6 |
| Grand Rapids, MI | 0.8% | 41 | 1.3% | 43 | -38.4% | 20 |
| Hartford, CT | 1.9% | 16 | 2.2% | 24 | -12.7% | 4 |
| Honolulu, HI | 4.1% | 6 | 7.1% | 8 | -41.6% | 30 |
| Houston, TX | 1.3% | 26 | 1.9% | 28 | -32.4% | 13 |
| Indianapolis. IN | 0.6% | 48 | 0.7% | 51 | -6.2% | 1 |
| Jacksonville, FL | 0.7% | 44 | 1.2% | 45 | -41.2% | 29 |
| Kansas City, MO-KS | 0.5% | 51 | 0.8% | 49 | -38.6% | 21 |
| Las Vegas, NV | 1.8% | 17 | 2.8% | 21 | -35.0% | 15 |
| Los Angeles, CA | 2.8% | 9 | 4.7% | 12 | -41.2% | 28 |
| Louisville, KY-IN | 0.7% | 42 | 1.9% | 29 | -62.6% | 47 |
| Memphis, TN-MS-AR | 0.2% | 55 | 0.3% | 56 | -29.4% | 9 |
| Miami, FL | 2.0% | 14 | 2.9% | 19 | -30.8% | 11 |
| Milwaukee,WI | 1.7% | 18 | 2.9% | 18 | -39.3% | 22 |
| Minneapolis-St. Paul, MN-WI | 1.7% | 21 | 4.4% | 15 | -62.1% | 46 |
| Nashville, TN | 0.6% | 50 | 1.0% | 48 | -43.7% | 33 |
| New Orleans. LA | 1.4% | 23 | 2.1% | 26 | -32.3% | 12 |
| New York, NY-NJ-PA | 19.0% | 1 | 31.7% | 1 | -40.0% | 24 |
| Oklahoma City, OK | 0.2% | 54 | 0.5% | 53 | -49.8% | 39 |
| Orlando, FL | 0.8% | 40 | 1.4% | 42 | -40.2% | 25 |
| Philadelphia, PA-NJ-DE-MD | 4.7% | 5 | 9.3% | 7 | -48.9% | 36 |
| Phoenix, AZ | 0.9% | 33 | 1.8% | 32 | -49.6% | 38 |
| Pittsburgh, PA | 2.4% | 12 | 6.0% | 10 | -59.0% | 43 |
| Portland, OR-WA | 2.3% | 13 | 6.6% | 9 | -65.4% | 51 |
| Providence, RI-MA | 1.2% | 28 | 1.7% | 34 | -29.7% | 10 |
| Raleigh, NC | 0.4% | 52 | 0.7% | 52 | -37.4% | 17 |
| Richmond, VA | 0.9% | 37 | 1.6% | 35 | -45.9% | 34 |
| Riverside-San Bernardino, CA | 0.7% | 45 | 0.8% | 50 | -9.9% | 2 |
| Rochester, NY | 1.4% | 22 | 1.9% | 31 | -23.9% | 7 |
| Sacramento, CA | 0.9% | 38 | 2.2% | 25 | -60.8% | 44 |
| St. Louis,, MO-IL | 1.2% | 27 | 1.7% | 33 | -29.4% | 8 |
| Salt Lake City, UT | 2.0% | 15 | 3.8% | 16 | -48.0% | 35 |
| San Antonio, TX | 1.1% | 29 | 1.9% | 27 | -41.0% | 27 |
| San Diego, CA | 1.7% | 19 | 2.9% | 20 | -39.3% | 23 |
| San Francisco, CA | 4.9% | 3 | 18.1% | 2 | -72.9% | 55 |
| San Jose, CA | 1.1% | 30 | 5.8% | 11 | -80.2% | 56 |
| Seattle, WA | 3.0% | 8 | 10.9% | 6 | -72.2% | 54 |
| Tampa-St. Petersburg, FL | 0.7% | 46 | 1.1% | 46 | -37.9% | 18 |
| Tucson, AZ | 1.4% | 25 | 1.6% | 36 | -16.6% | 5 |
| Tulsa, OK | 0.1% | 56 | 0.5% | 54 | -72.0% | 53 |
| Virginia Beach-Norfolk, VA-NC | 1.0% | 31 | 1.6% | 38 | -35.8% | 16 |
| Washington, DC-VA-MD-WV | 4.1% | 7 | 13.2% | 3 | -69.0% | 52 |
| Derived from American Community Survey, 2019 & 2021 | ||||||


Bay Area
Although most national media attention has been trained on NYC, it's apparent that the most dire dropoff in transit and office-district use has been in the San Francisco Bay Area. The agencies and landlords there must be facing severe stress.